The U.S. exploration and production (E&P) sector roared out of the starting gate in 2017 with a new optimism that fueled a more than 40% surge in capital investment. First-quarter results were strong, but an ebb in oil prices and some operational headwinds significantly lowered results in subsequent quarters. When final 2017 results are tallied in the next few weeks, the industry is on track to record its first profitable year since 2013 after posting more than $160 billion in losses in the 2014-16 period. The critical question is whether E&Ps are regaining the momentum that could drive a steady increase in profitability in 2018. Today, we analyze the clues contained in third-quarter 2017 results.
We have been intensely tracking the financial performance of a representative group of U.S. E&Ps for more than a year now. In our in-depth Piranha! study, we examined the strategies that our universe of 43 top U.S. oil and gas producers adopted to thrive in a world of lower oil and gas prices. We reviewed the promising results of those strategies in the first quarter of 2017 in Recovery and subsequent blogs focused on our three peer groups: Oil-Weighted, Diversified, and Gas-Weighted E&Ps. We tracked the disappointing second-quarter performance of those companies in another blog series beginning with Roller Coaster. And last month, in Ready To Run, we updated our forecasted 2017 capital spending and production projections based on the companies’ third-quarter earnings releases and reviewed announcements by 13 E&Ps of their preliminary 2018 capital spending budgets, which indicated that oil and gas producers are likely to boost spending once again. Today’s review of third-quarter results from all 43 of the companies in our universe will provide insights into whether that continued optimism is justified.
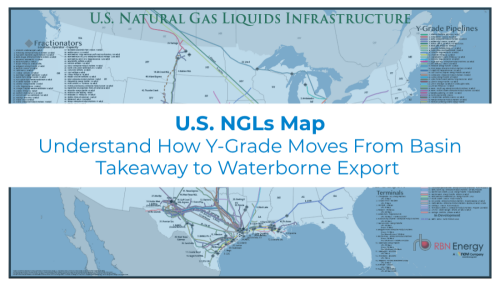
Visualize the infrastructure behind U.S. NGL movement.
The U.S. NGLs Map provides a comprehensive view of the transport, processing, and export networks moving NGLs across the U.S.
As seen in Figure 1, upstream pre-tax operating profits for the 43 E&Ps we follow totaled $1.9 billion, or $1.90/boe (barrels of oil equivalent) [purple rectangle] in the third quarter of 2017, compared with a net loss of $748 million in the second quarter. However, results in both periods were distorted by large impairments by major E&P firms. Excluding these outlying write-downs, third-quarter 2017 profits totaled $4.79 billion, well below the adjusted $5.9 billion reported in the previous quarter and the $6.8 billion generated in the first three months of the year. Cash flow, which excludes the impact of reserve write-downs, DD&A (depreciation, depletion and amortization) and exploration expenses, was $18.3 billion (gray rectangle), flat with the previous quarter. Despite the approximate $5/bbl rise in the WTI (West Texas Intermediate) oil price during the third quarter, oil and gas price realizations remained uninspiring at $28.66/boe, slightly higher than $28.52/boe in the second quarter of 2017. Lifting costs rose nearly 3% to $10.27/boe because of an increase in both production costs and production taxes. Production costs increased 3% to $8.91/boe, while production taxes increased $0.04/boe to $1.35/boe. Normal DD&A remained relatively stable, increasing 3% to $11.84/boe. Impairments totaled nearly $2.9 billion (dark blue rectangle), down from $6.6 billion in the previous period. E&Ps spent more heavily on exploration –– $1.73/boe (black rectangle) versus $1.07/boe in the previous period. Diamondback Energy was the most profitable company among those we track during the third quarter, earning $20.12/boe on revenues of over $38.00/boe. Our universe of companies produced 996 MMboe (millions barrels of oil equivalent) during the third quarter of 2017, slightly higher than the 995 MMboe and 993 MMboe produced in the second and first quarters, respectively. ConocoPhillips was the largest producer, accounting for about 11% of total output.

About the song
“Slip Sliding Away” was written by Paul Simon and has appeared on the compilation albums Greatest Hits, Etc. and Negotiations and Love Songs. The song was originally recorded and slated for release on Simon’s 1975 album, Still Crazy After All These Years, but at the last minute Simon decided not to include it on the album. Released as a single in October 1977, it went to #5 on the Billboard Hot 100 and #4 on the Easy Listening Singles charts. It has been certified Gold by the Recording Industry Association of America. Personnel on the record were: Paul Simon (lead vocals, acoustic guitar), Anthony Jackson (Bass), Richard Tee (Fender Rhodes electric piano), Steve Gadd (drums), Ralph McDonald (percussion), and The Oak Ridge Boys (backing vocals).
Simon was half of the popular duo Simon & Garfunkel, which was officially formed in 1964 and sold millions of records until their breakup in 1970. A little-known fact is that Paul Simon and Art Garfunkel had been a team since they were teenagers. Under the name Tom & Jerry, the duo got a record deal in 1957 with the independent New York record label, Big Records. They had a minor hit with the Simon-penned “Hey Schoolgirl,” which went to #49 on the Billboard Hot 100 Singles chart and led to an appearance on American Bandstand with Jerry Lee Lewis, who was promoting “Great Balls of Fire” at the time. Between 1957 and 1964, Simon wrote, recorded, and released more than 30 records.
As a solo artist. Paul Simon has released 15 studio albums, three live albums, 11 compilation albums and 15 singles. He has won 16 Grammy Awards and a Grammy Lifetime Achievement Award, and has been inducted into the Rock and Roll Hall of Fame twice: as a member of Simon & Garfunkel in 1990 and as a solo artist in 2001. He continues to write and record, and to make occasional public appearances. He released his 15th solo studio album, Seven Psalms, in May 2023. It went to #25 on the Billboard Top Rock Albums chart and #153 on the Billboard 200 Albums chart.