


The EIA reported a 1.6-MMbbl draw in total U.S. propane/propylene inventories for the week ended October 30, the fifth draw in a row and well above the 960-Mbbl draw the industry expected. Stocks fell to 104.1 MMbbl (red line in the chart below), 2 MMbbl, or 2%, below the same week last year (blue line), the first time they have been below last year since October 2025. Stocks are still 10.3 MMbbl, or 11%, above the five-year average (green line). They have fallen 6.4 MMbbl since hitting a record 110.5 MMbbl on September 4, while the five-year average rose 5.5 MMbbl over the same weeks.

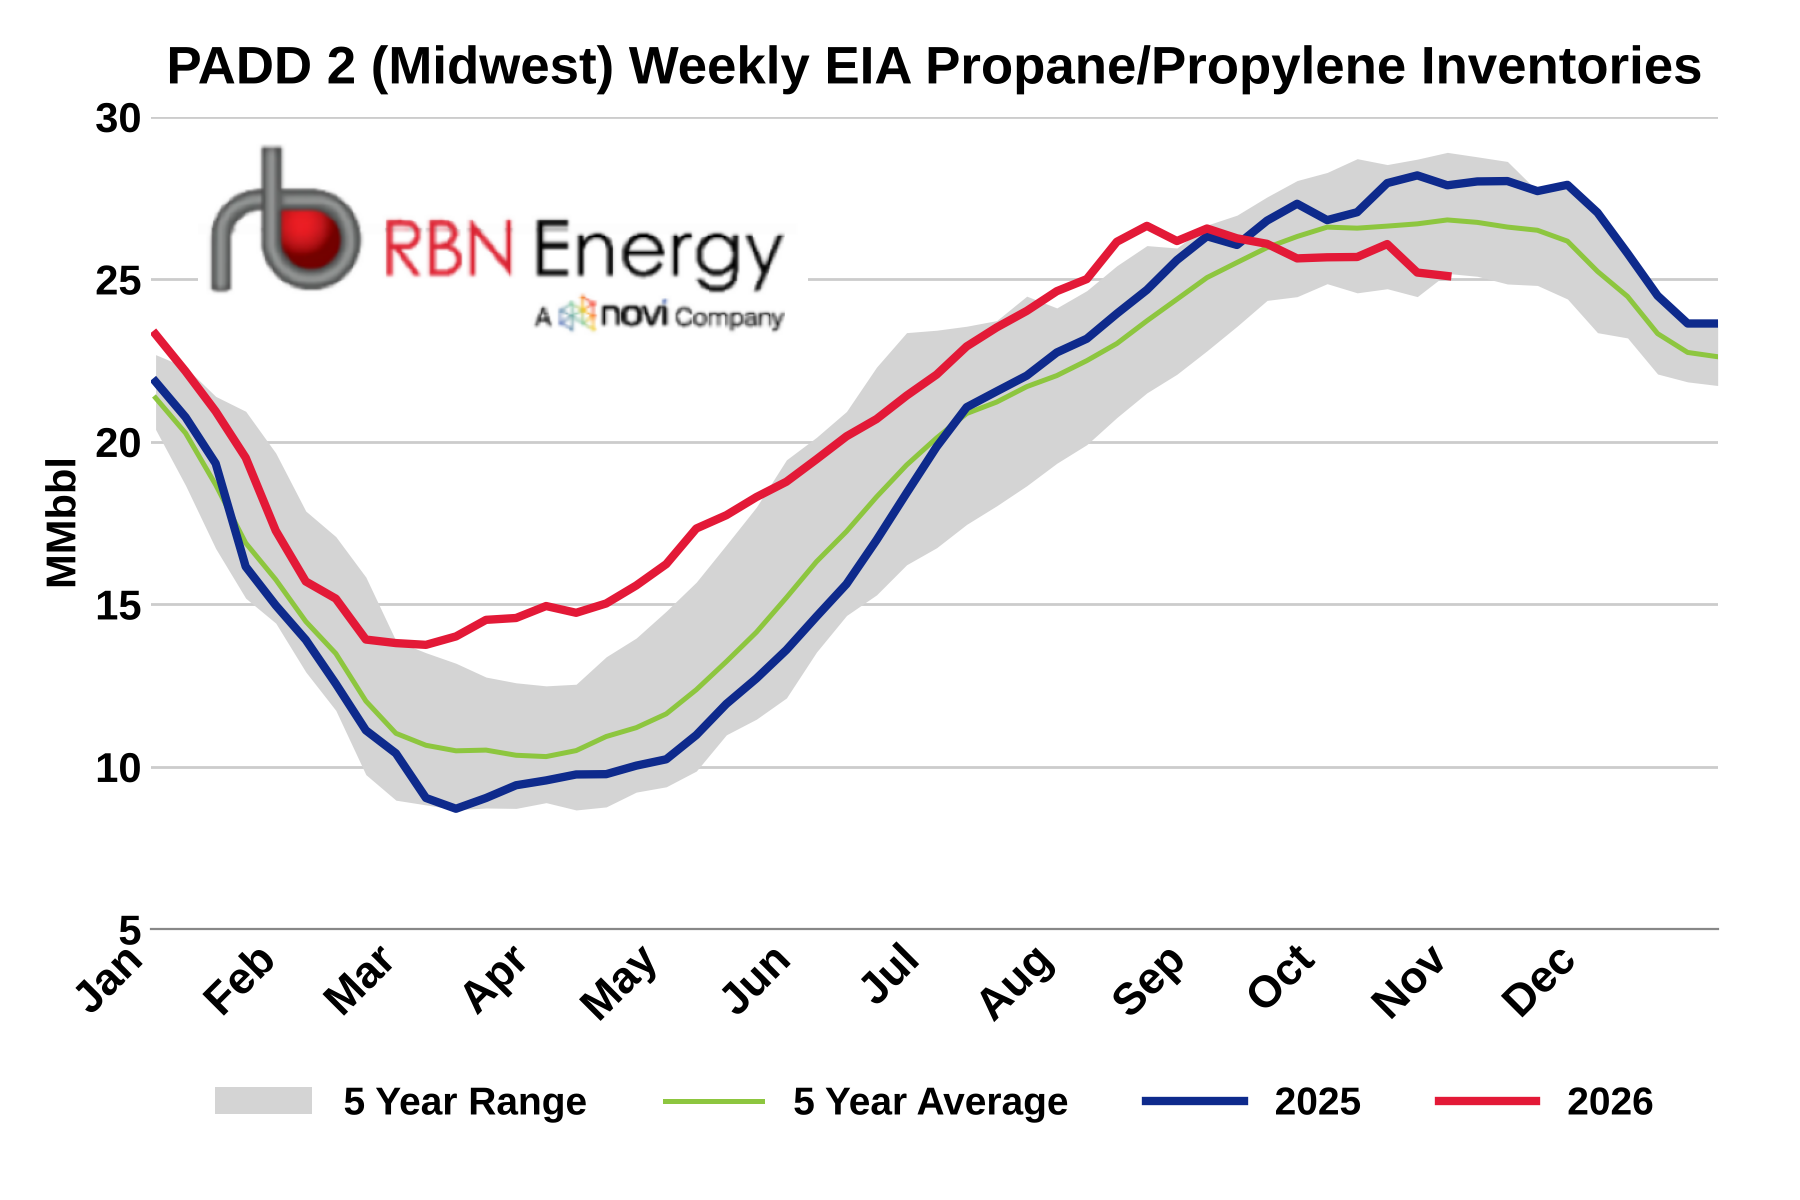
The national number hides where the shortfall is. The Gulf Coast (PADD 3), which holds 62% of U.S. stocks, is still 1.6 MMbbl above last year and above its previous five-year maximum. The rest of the country is a combined 3.6 MMbbl below last year, and the Midwest (PADD 2) accounts for most of it. Midwest stocks were 25.1 MMbbl, which is 2.8 MMbbl, or 10%, below last year and 80 Mbbl below the five-year minimum for the week (red line in the chart below). They were above last year as recently as September 11, but have fallen 1.5 MMbbl since September 4, while last year they built 1.6 MMbbl over the same weeks. East Coast (PADD 1) stocks are 892 Mbbl, or 9%, below last year.
Those regional shortfalls matter more now that heating season is starting. This week's draw came from domestic demand, not exports: product supplied jumped 680 Mb/d to 1.44 MMb/d, while exports fell 364 Mb/d to 1.87 MMb/d. Demand will keep climbing through the winter, and much of it is in the Midwest and East Coast. That leaves the two regions that need propane most this winter starting the season with less in storage than a year ago.
