


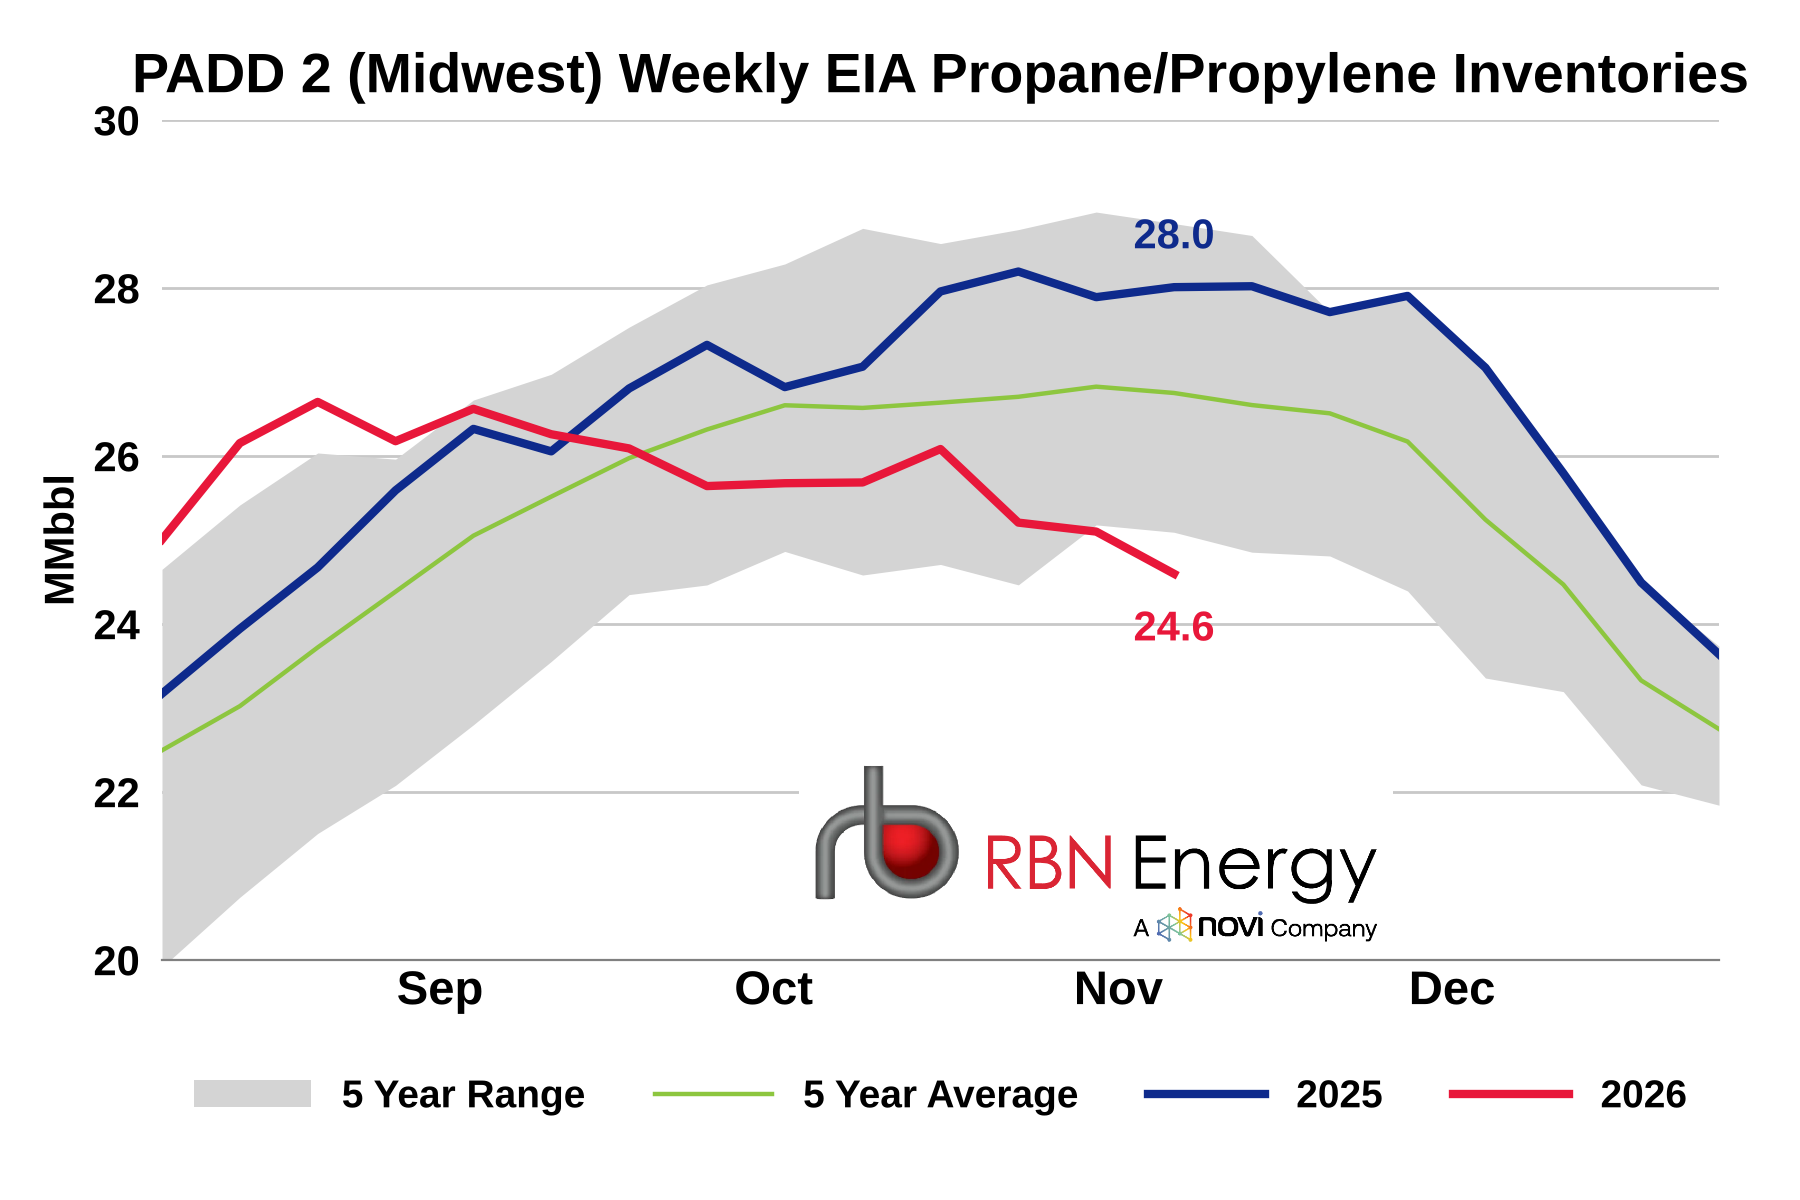
The EIA reported a 91-Mbbl build in total U.S. propane/propylene inventories for the week ended November 6, against industry expectations of a 260-Mbbl draw. The build came from PADD 1 and 2: the East Coast (PADD 1) added 429 Mbbl and the Gulf Coast (PADD 3) added 339 Mbbl. The Midwest (PADD 2) went the other way. Midwest stocks fell 502 Mbbl, their third draw in a row, to 24.6 MMbbl (red line in the chart below). That is 3.4 MMbbl, or 12%, below the same week last year (blue line) and 494 Mbbl below the five-year minimum, the lowest level for this week since 2013. Midwest stocks have fallen 2.0 MMbbl since September 4, while they built 1.7 MMbbl over the same weeks in 2025.
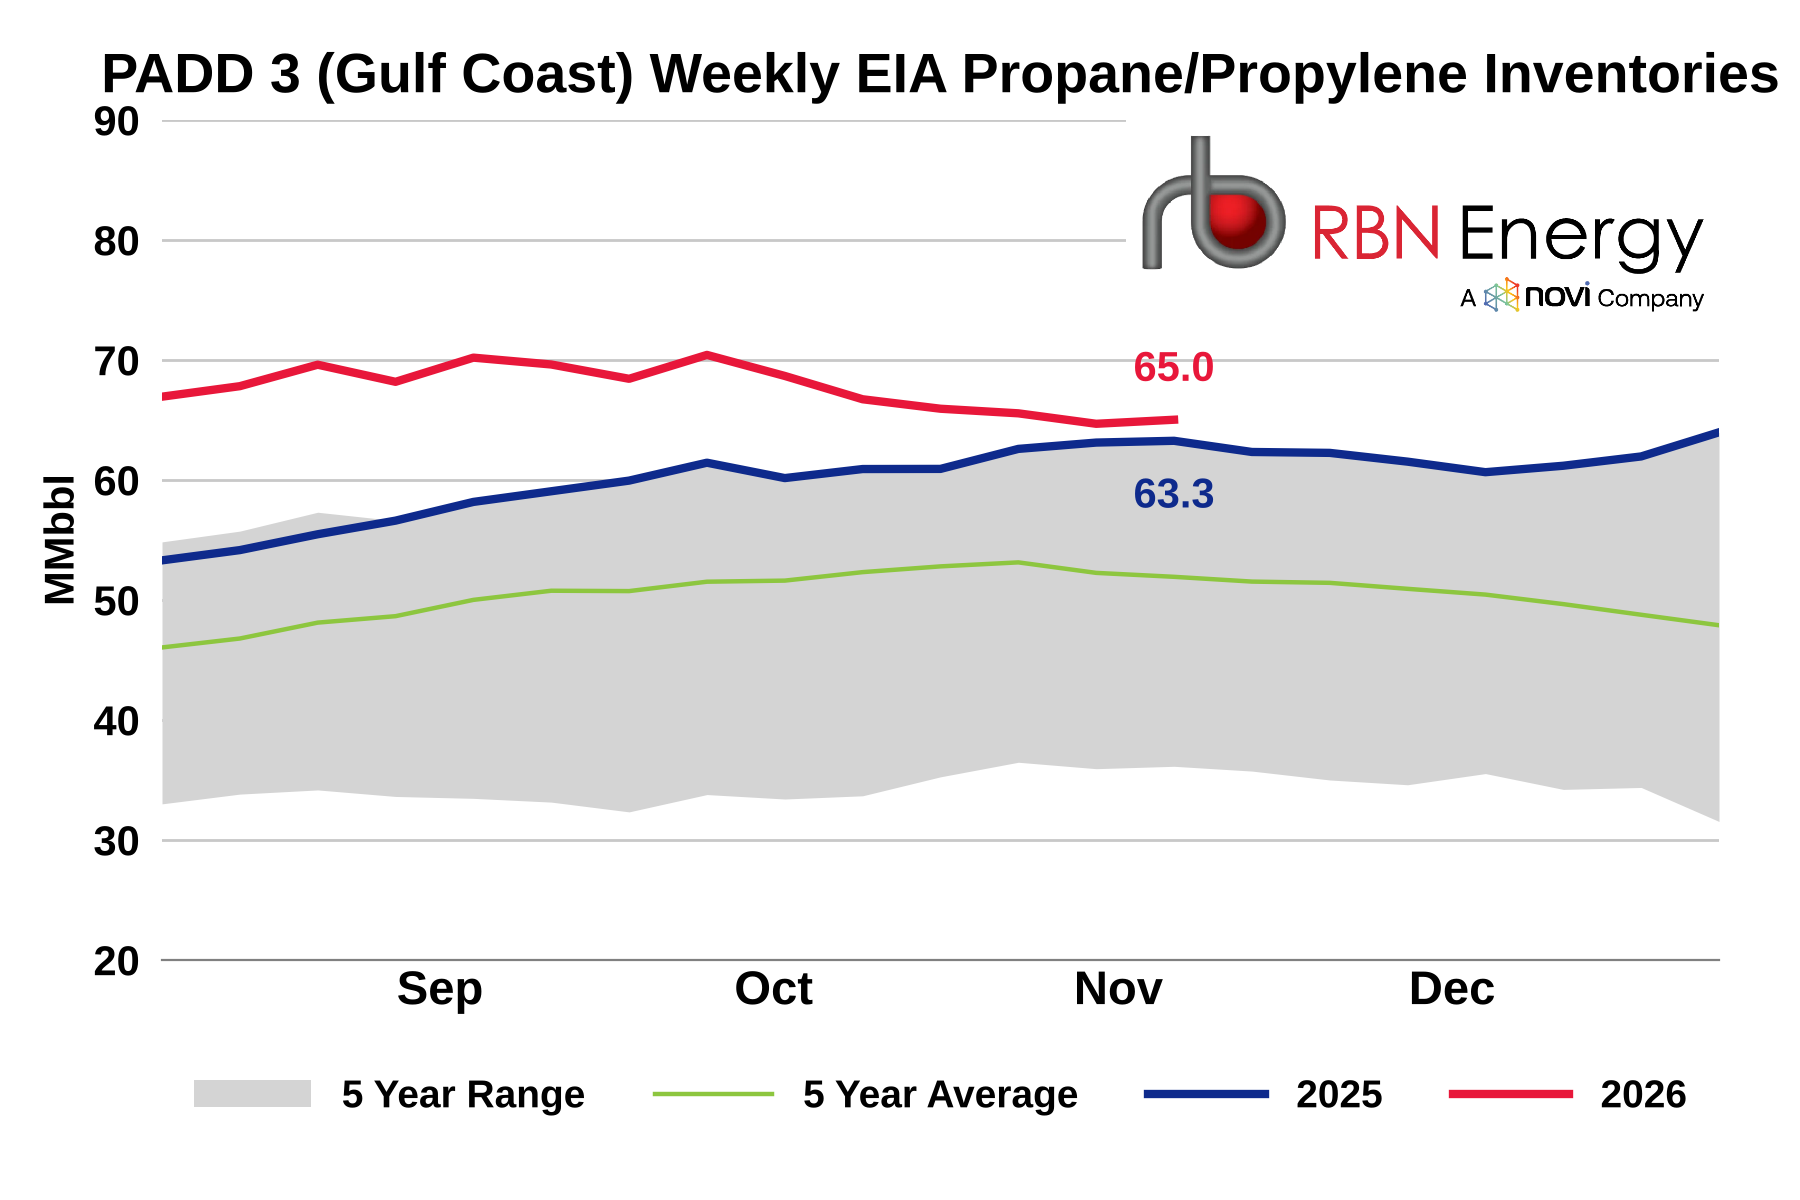
The Gulf Coast is on the other side of the ledger. Stocks there rose 339 Mbbl to 65 MMbbl, ending a run of five straight draws (red line in the chart below). That is 1.8 MMbbl, or 3%, above last year (blue line) and the five-year maximum, and 13.1 MMbbl, or 25%, above the five-year average (green line). The region now holds 62% of U.S. propane/propylene stocks. Gulf Coast stocks have drawn 5.2 MMbbl since September 4, but they started from such a high level that they remain well above the range of the past five years.
This week's surprise build came from weaker domestic demand, not lower exports. U.S. product supplied fell 542 Mb/d to 898 Mb/d, 18% below the five-year average, while exports rose 303 Mb/d to 2.17 MMb/d, above both the four-week average of 2.08 MMb/d and the 1.93 MMb/d of the same week last year. The national surplus is sitting on the Gulf Coast, near the export docks, not where winter demand will be. The Midwest heads into heating season with less propane in storage for this time of year than in any year since 2013, leaving less cushion if cold weather arrives early.
