


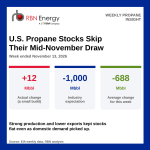
U.S. propane/propylene inventories were essentially unchanged in the week ended November 13, edging up 12 Mbbl to 104.2 MMbbl. Industry expectations called for a 1-MMbbl draw, and this week usually brings one: across 2016-2026, the average change is a 688-Mbbl draw (green bar in the chart below). This year's build (red bar) is only the third for this week on the chart, after 2016 and 2022, and it follows a 91-Mbbl build the week before.

Stocks held flat even though domestic demand picked up. Product supplied rose 242 Mb/d to 1,140 Mb/d, 15% above the five-year average, which on its own would have pulled inventories down. Two things made up for it. First, supply is strong. U.S. production edged up 8 Mb/d to 2,967 Mb/d (red line in the chart below), 107 Mb/d, or 4%, above the same week last year (blue line), and it has run above the five-year range (gray area) in 45 of the 46 weeks reported this year. Second, exports slipped 210 Mb/d to 1,962 Mb/d, 97 Mb/d below their four-week average. Over seven days, that is about 680 Mbbl that would have been shipped out at the recent export rate but stayed in the U.S. instead.

Where that propane sits matters more as winter approaches. Midwest (PADD 2) stocks rose 488 Mbbl this week to 25.1 MMbbl (red line in the chart below), their first build in three weeks, and moved back above the five-year minimum after last week's low. Even so, the Midwest is still short: stocks there are 2.9 MMbbl, or 10%, below last year (blue line) and 1.5 MMbbl, or 6%, below the five-year average (green line). That is a very different picture from the U.S. as a whole, where stocks are 11.2 MMbbl, or 12%, above the five-year average. The national surplus is on the Gulf Coast (PADD 3). Stocks there fell 707 Mbbl this week to 64.3 MMbbl but are still 12.8 MMbbl, or 25%, above their own five-year average, more than the entire national surplus.

