

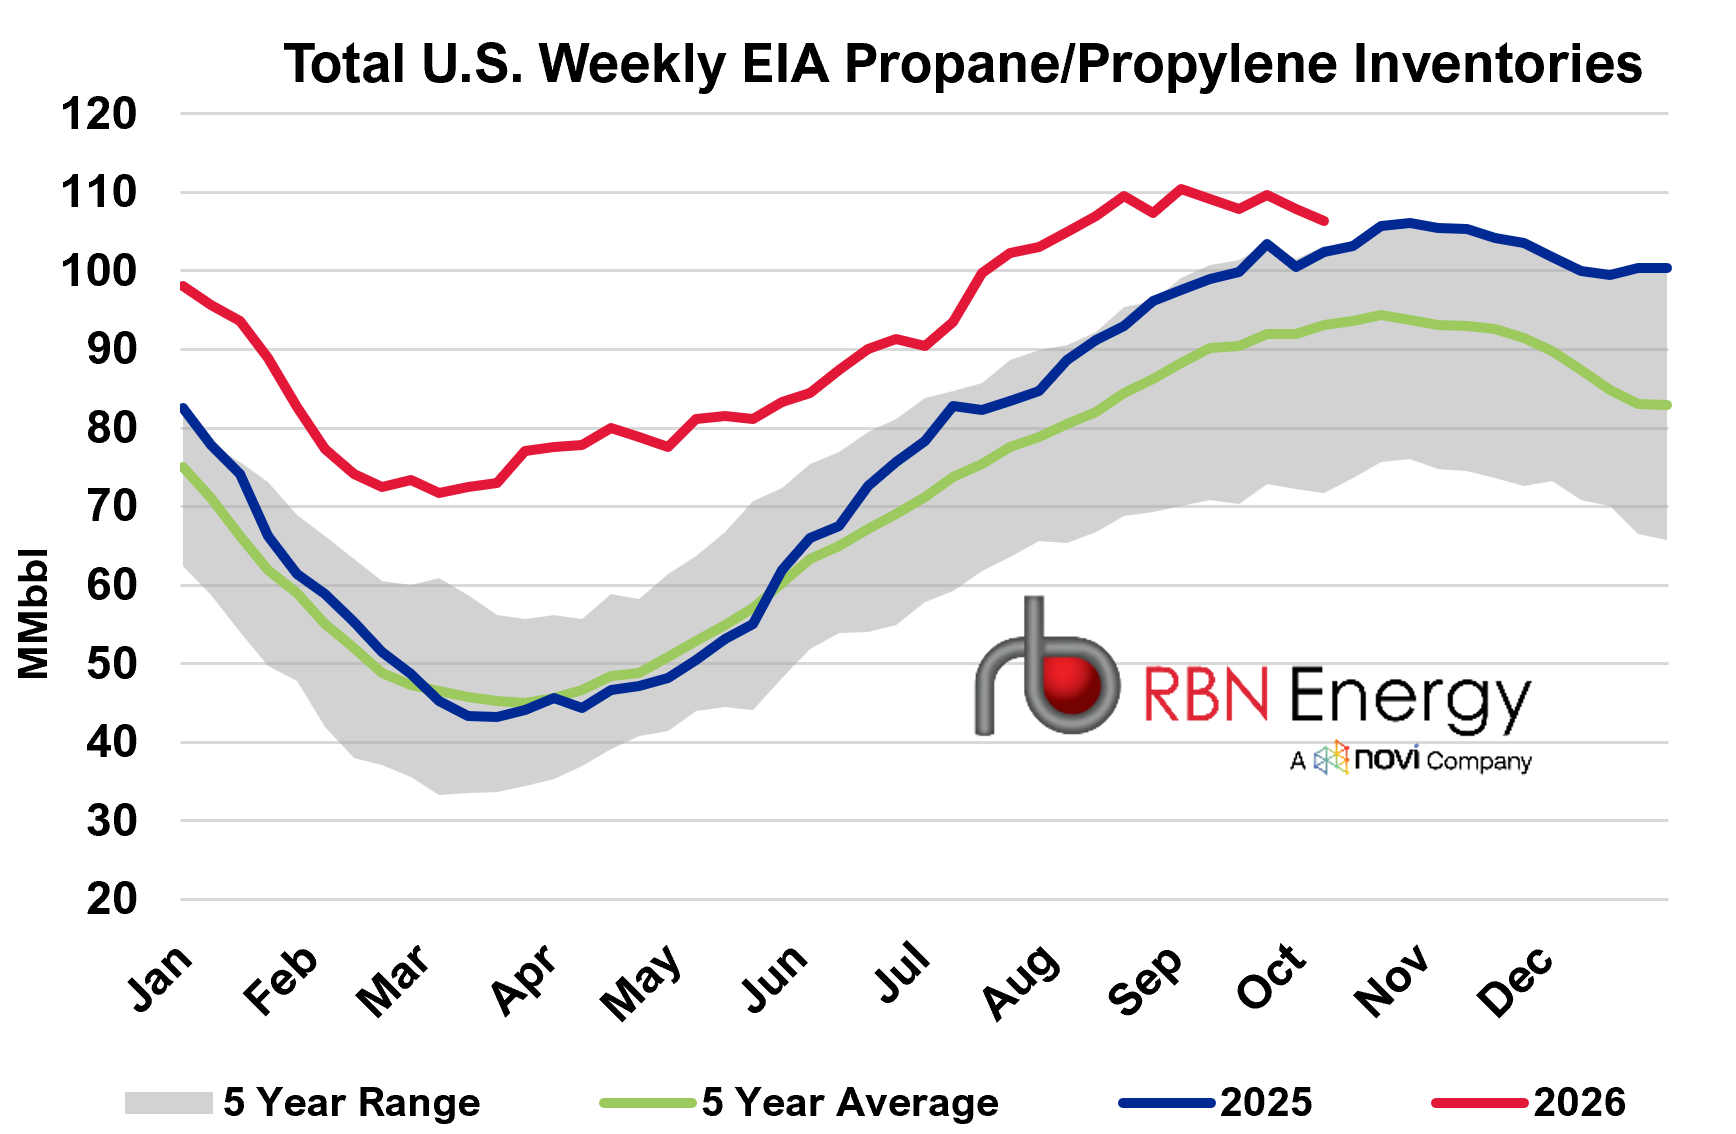
The EIA reported a 1.5-MMbbl draw in total U.S. propane/propylene inventories for the week ended October 9, lowering stocks to 106.4 MMbbl (red line in the chart below). The draw was about twice the industry-expected draw of 730 Mbbl, ran counter to the average build of 324 Mbbl for the week, and extended the prior week's 1.8-MMbbl draw. Even so, stocks are 4 MMbbl, or 4%, above the same week in 2025 (blue line), 3.2 MMbbl, or 3%, above the five-year maximum, and 13.3 MMbbl, or 14%, above the five-year average (green line).
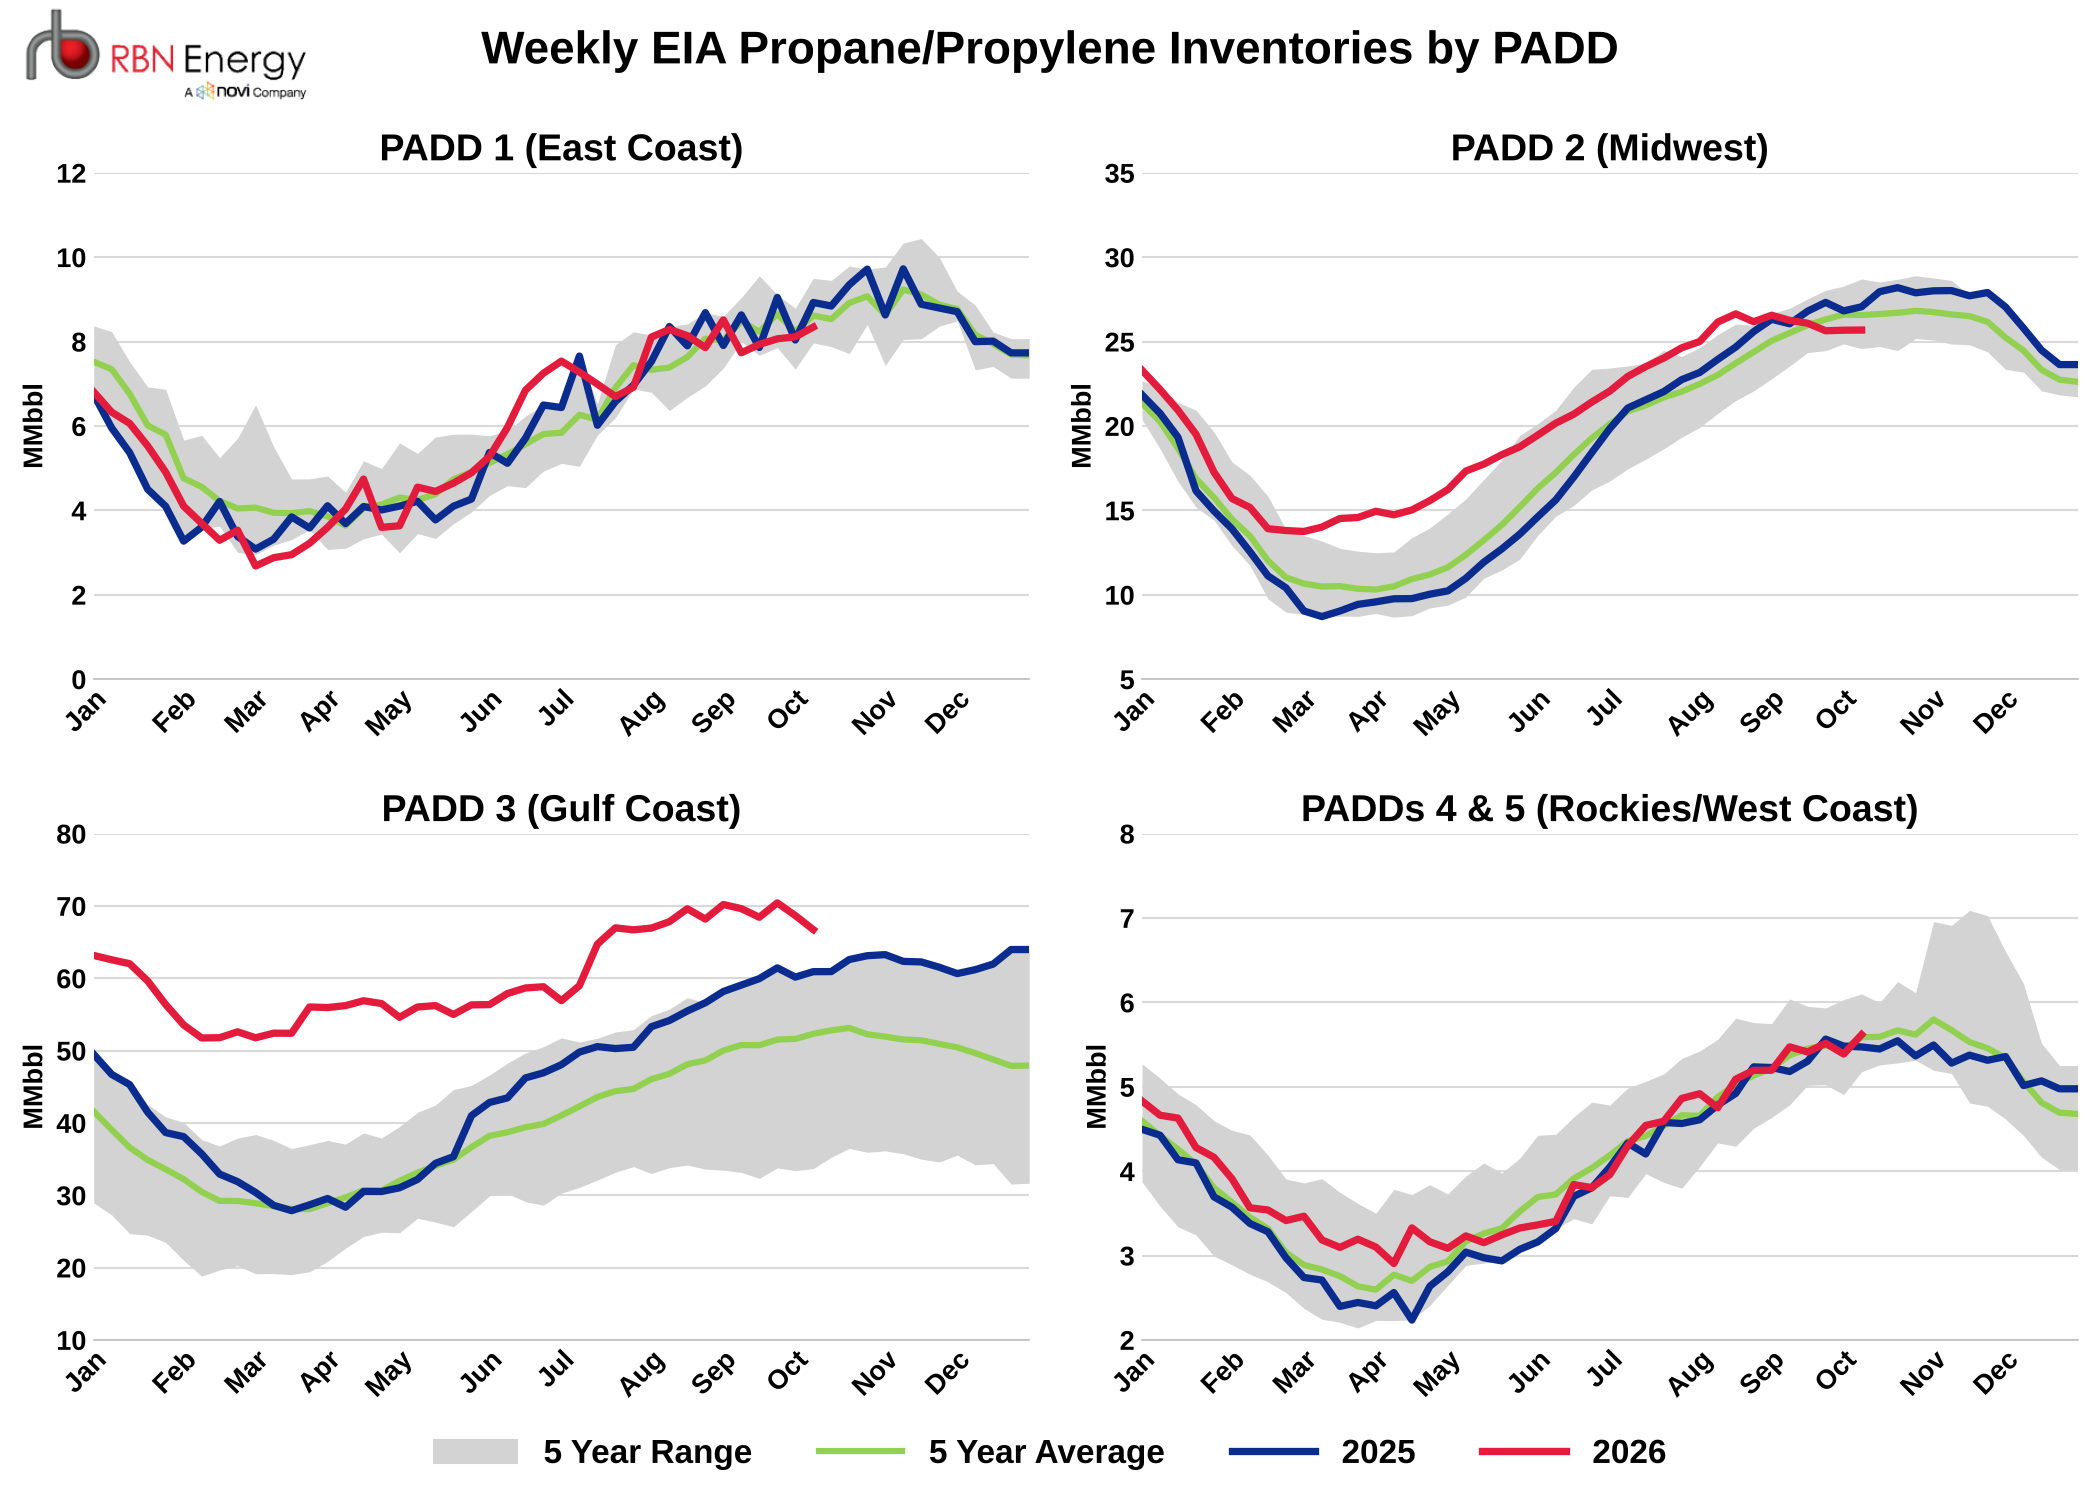
The national totals mask a regional split (see the PADD charts below). PADD 3 (Gulf Coast) accounted for the entire draw, falling 1.9 MMbbl to 66.7 MMbbl, down 3.7 MMbbl from the record 70.4 MMbbl set in late September but still 28% above the five-year average. The more telling trend is in PADD 2 (Midwest). Stocks there peaked at 26.6 MMbbl on August 21 and have slipped about 1 MMbbl since, even as the five-year average climbed 2.9 MMbbl. As a result, Midwest stocks of 25.7 MMbbl are now 887 Mbbl, or 3%, below the five-year average, 5% below last year and just 1.1 MMbbl above the five-year minimum. PADD 1 (East Coast) stocks, at 8.3 MMbbl, are 7% below last year, while PADDs 4 and 5, at 5.6 MMbbl, sit in line with the five-year average. Combined, PADDs 1, 2, 4 and 5 hold 39.6 MMbbl, 1.8 MMbbl, or 4%, below the same week in 2025, leaving the national surplus concentrated on the Gulf Coast heading into the heating season.