


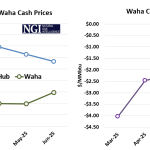
Over the past three months, spot-market prices at Henry Hub and Permian Waha have been steadily converging. As shown in the left graph below, Waha March gas traded at a mere $0.08/MMBtu (outright price), while Henry Hub fetched $4.12/MMBtu—creating a staggering basis spread of $4.04/MMBtu. That spread ranks as the second-largest monthly basis ever recorded, surpassed only by February 2021 during Winter Storm Uri.
Featured Articles


- Blog
Higher Ground - With New Pipeline Capacity, Permian Oil and Gas Prices Ascend the Basis Cliff
Battered by a flood of new supply and limited pipeline takeaway capacity, prices for Permian natural gas and crude oil have spent a lot of time in the valley over the past 18 months. West Texas Intermediate (WTI) crude oil prices at the Permian’s Midland Hub traded as much as $20/bbl less than similar quality crude in Houston last year. That’s a big oil-price haircut that producers have had to absorb while ramping up production. However, the collapse in the Permian crude oil differential was tame compared to what happened with Permian natural gas prices. Prices at the Waha Hub in West Texas traded as low as negative $5/MMBtu, a gaping $8/MMBtu discount to benchmark Henry Hub in Louisiana. As bad as that all was, new pipeline takeaway capacity has arrived, and Permian prices are beginning to claw their way out of the depths. Today, we look at how new pipelines are impacting the prices received for Permian natural gas and oil.


- Blog
Wild, Wild West - Natural Gas Price Blowouts Signal Worsening Westbound Supply Constraints
Last week, even as natural gas day-ahead prices went negative in the Permian’s Waha Hub in West Texas, spot prices at northern California’s PG&E Citygate last week traded at a record-smashing $55/MMBtu, according to the NGI Daily Gas Price Index — close to 100x the Waha price. Other hubs west of the Continental Divide also surged to record levels, while markets just east and north of there were largely unruffled — a sure sign of bottlenecks for moving gas into West Coast markets. This is just the latest instance of severe gas supply shortages and constraint-driven price disruptions out West in recent years (even ignoring Winter Storm Uri and the Deep Freeze of February 2021). Moreover, it’s arguably taking progressively more benign market events to trigger similar or worse shortages. What’s going on? In today’s RBN blog, we break down the factors driving the latest Western U.S. gas price spikes.


- Blog
East is East, West is West - U.S. Natural Gas Spot Prices Race to $600/MMBtu as Midcon Runs Out of Gas
Physical natural gas spot prices in the U.S. Midcontinent trading as high as $600/MMBtu, while Northeast prices barely flinch – that was the upside-down reality physical traders were contending with Friday in trading for the long weekend, with Winter Storm Uri bearing down on large swaths of the Lower 48 and spreading bitter-cold, icy weather from the Midwest and Northeast to Texas and the Deep South. The record-shattering, triple-digit spot prices, mostly all west of the Mississippi River, were indicative of some of the worst supply shortages the market has seen during the generally oversupplied Shale Era, or ever. But the East vs. West price divergence also marks the culmination of years of shifting gas supply and flow patterns that have redefined regional dynamics. The market will be digesting the various impacts of this still-unfolding event for days, but some of the effects and implications can be gleaned already from daily pipeline flows. In today’s blog we provide an early look at the market impacts of the polar plunge.
