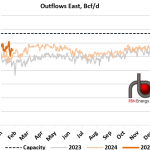
Overall outflows from the Permian Basin are down 0.3 Bcf/d week-on-week for the week ended Monday, driven by lower outflows to the East at the beginning of the week during production freeze-offs. Outflows to directions other than the East were all up week-on-week. Meanwhile, outflows to the East averaged 10.8 Bcf/d, down 0.6 Bcf/d week-on-week in a dip that can be seen in the orange line in the graph below. Outflows East were lowest during the freeze-offs but remained relatively weak even after production had rebounded. Both Texas LNG terminals, which use Permian production as feedgas, saw reductions in feedgas demand from the cold weather.
Featured Articles


- Blog
East is East, West is West - U.S. Natural Gas Spot Prices Race to $600/MMBtu as Midcon Runs Out of Gas
Physical natural gas spot prices in the U.S. Midcontinent trading as high as $600/MMBtu, while Northeast prices barely flinch – that was the upside-down reality physical traders were contending with Friday in trading for the long weekend, with Winter Storm Uri bearing down on large swaths of the Lower 48 and spreading bitter-cold, icy weather from the Midwest and Northeast to Texas and the Deep South. The record-shattering, triple-digit spot prices, mostly all west of the Mississippi River, were indicative of some of the worst supply shortages the market has seen during the generally oversupplied Shale Era, or ever. But the East vs. West price divergence also marks the culmination of years of shifting gas supply and flow patterns that have redefined regional dynamics. The market will be digesting the various impacts of this still-unfolding event for days, but some of the effects and implications can be gleaned already from daily pipeline flows. In today’s blog we provide an early look at the market impacts of the polar plunge.


- Blog
Runaway Train - The Supply-Demand Fundamentals Spurring $6-Plus Natural Gas Prices
Prompt CME/NYMEX Henry Hub natural gas futures prices averaged $4.54/MMBtu this winter, up 67% from $2.73/MMBtu in the winter of 2020-21 and the highest since the winter of 2009-10. Prices have barreled even higher in recent days, despite the onset of the lower-demand shoulder season, with the May contract hitting $6.643/MMBtu on Monday, the highest since November 2008 and up more than $1 from where the April futures contract expired a couple of weeks ago. Europe’s push to reduce reliance on Russian natural gas has turned the spotlight on U.S. LNG exports and their role in driving up domestic natural gas prices. However, a closer look at the Lower 48 supply-demand balance this winter vs. last suggests that near-record domestic demand, along with tepid production growth, also played a significant role in drawing down the storage inventory and tightening the balance. Today’s RBN blog breaks down the gas supply-demand factors that shaped the withdrawal season and contributed to the current price environment.


- Blog
Turn the Page - Producer Restraint, Tighter Balances Disrupt Appalachian Gas Market Trends
Before the bullish winter of 2021-22, it appeared the Northeast natural gas market was headed for familiar territory: worsening seasonal takeaway constraints and deeper, constraint-driven price discounts starting as early as this spring. Instead, the market went in the other direction the past few months. Takeaway utilization out of Appalachia has been lower year-on-year and, for the most part, Appalachian supply basin prices have followed Henry Hub higher even as that benchmark rocketed to 14-year highs. That’s not to say that constraints out of the Northeast aren’t on the horizon. But the market is now poised to escape the worst of it this year, despite the completion of the last major takeaway pipeline project in the region, Mountain Valley Pipeline (MVP), being pushed out another year or longer, if it crosses the finish line at all. In today’s RBN blog, we provide an update on regional fundamentals and what recent trends mean for gas production growth and pricing in the region.