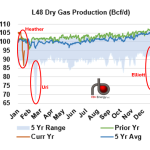
As cold weather swept across the country over the past week, natural gas production plumbed depths not seen in more than a year. Winter Storm Heather’s icy blasts created freeze-offs at wellheads, and U.S. Lower 48 dry gas production hit a low of 86.6 Bcf on January 16, which was down 17% from its level just a week earlier. While the drop had a significant impact on daily cash markets, it was far smaller than the impact of Winter Storm Eliott in December 2022. That storm saw dry gas production crater to a low of 75.9 Bcf on Christmas Eve, which was 26% lower than just a week earlier. A similar production decline occurred during the infamous Winter Storm Uri in February of 2021, when total production bottomed out at 66.3 Bcf/d, down 25% from one week prior.
Featured Articles


Heat of the Moment - High Gas Production, Historically Low Heating Demand Keep a Lid on Prices
So far this winter, front-month CME/NYMEX natural gas futures have fallen, risen and fallen again but, until their most recent dip, generally remained within the same $2.30-to-$3.30/MMBtu range where they have been lingering since mid-2023. With production sustaining near-record levels, LNG export volumes down from the winter highs, and temperatures back to normal, the supply of gas remains plentiful — a bearish scenario. In today’s RBN blog, we look at why there’s been a lid on natural gas prices — and the odds that the situation might change before the rapidly-approaching end of the winter season.


Out of This World – Latest Cold Blast Sets New Records for the Canadian Gas Market
In a part of the world where enduring a cold winter is often seen as a badge of honor, the latest cold blast that descended on Canada just before Christmas — and during Christmas in the U.S. — was another one for the natural gas record books. By almost every measure, the recent frigid temperatures, though not long-lasting, set new Canadian records for daily demand, storage withdrawals, and net exports to the U.S., and went well beyond the records set during Winter Storm Uri in February 2021. In today’s RBN blog, we delve into the latest record-busting Canadian gas data.


East is East, West is West - U.S. Natural Gas Spot Prices Race to $600/MMBtu as Midcon Runs Out of Gas
Physical natural gas spot prices in the U.S. Midcontinent trading as high as $600/MMBtu, while Northeast prices barely flinch – that was the upside-down reality physical traders were contending with Friday in trading for the long weekend, with Winter Storm Uri bearing down on large swaths of the Lower 48 and spreading bitter-cold, icy weather from the Midwest and Northeast to Texas and the Deep South. The record-shattering, triple-digit spot prices, mostly all west of the Mississippi River, were indicative of some of the worst supply shortages the market has seen during the generally oversupplied Shale Era, or ever. But the East vs. West price divergence also marks the culmination of years of shifting gas supply and flow patterns that have redefined regional dynamics. The market will be digesting the various impacts of this still-unfolding event for days, but some of the effects and implications can be gleaned already from daily pipeline flows. In today’s blog we provide an early look at the market impacts of the polar plunge.