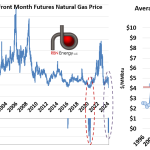
With the exception of three days in 2020 when the pandemic was ravaging energy markets, natural gas prices held above $1.59/MMbtu for the past 28 years – until last week. The graph on the left below shows the daily front month futures price of natural gas going back to January 1996, with the close up at the bottom of the graph showing the only days when prices were lower than $1.75/MMbtu. The red dashed oval highlights the period in 2020 when prices were sub-$2.60/MMbtu. The purple dashed oval shows prices last week.
So far this year, natgas has averaged $2.36/MMbtu (right graph, red dot), compared to the average price over the past 28 years of $4.12/MMbtu (red line). The only years lower than YTD 2024 were 1998, 1999 and 2020. Could natgas go lower this year? Most definitely. The traditionally weak shoulder season is just ahead.