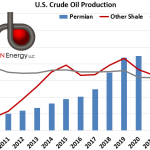
Of course it’s all about the Permian – the basin that everybody knows is responsible for the crude oil shale revolution. But to see it play out graphically is still pretty amazing – see below. The grey line is production from legacy basins – 3.8 MMb/d in 2009, drifting off to 3.3 MMb/d so far this year. All the other shale basins besides the Permian are shown by the red line – skyrocketing from 0.6 MMb/d in 2009 up to 3.9 MMb/d in 2015, but then for the next nine years middling about, coming in so far this year at 3.6 MMb/d.
And then there’s the Permian in the blue bars. A piddly 0.9 MMb/d in 2009, 2.0 by 2016, 4.4 in 2019, 6.1 MMb/d so far this year. The graph makes it clear. There would not have been a crude oil shale revolution without the Permian.