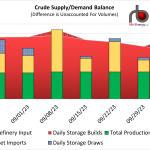
The crude oil balance transformed from a seesaw to a catapult last week, as supplies soared while demand plummeted. Crude production hit an all-time high of 13.2 MMb/d last week due to a massive 370 Mb/d jump caused by re-benchmarking by the EIA. Imports also contributed by rising 100 Mb/d to 6.3 MMB/d. While supplies were riding high, refinery input fell by another 400 Mb/d, now down from 16.8 MMb/d to 15.2 MMb/d in just four weeks due to an aggressive fall maintenance season, which could see almost another 1 MMb/d fall off before things get better. If that wasn’t bad enough, exports sank by 1.9 MMb/d to just 3.1 MMb/d. The 2.7 MMb/d positive swing in supplies resulted in a 10.1 MMbbl increase of stocks.
Featured Articles


- Blog
One Way Out - Yesterday's Crude Price Meltdown, Futures Contract Expiration and Crude Storage
We have now entered the crude oil twilight zone. Never before has crude traded below zero, much less at the absurd level of negative $37.63/bbl. There is no doubt that demand for crude and motor gasoline are far below crude production volumes, leaving the market vastly oversupplied. But could it really be this bad? When you are talking about the market for physical barrels, the answer is “no”. It is bad. Really bad. But what happened yesterday had more to do with the mechanics of futures contracts and how they transition from month to month, than a complete mega-meltdown in physical barrels. That is not to say that negative prices for physical barrels are not already a fact of life in some locations. But negative $37.63/bbl? Something else must be going on. So, to put yesterday’s bizarre market action in perspective, we need to get into a few details on futures contract mechanics, and then look forward to what may be coming over the next few weeks. In today’s blog, we discuss the factors that are driving such extraordinary crude market developments.


- Blog
One Piece at a Time - U.S. Crude Oil Supply/Demand Balances, Inventories and Pricing
Last week, crude oil prices dropped below $50/bbl, in part due to continued increases in U.S. crude oil inventories, and fell further over the next few days. Then yesterday, prices perked up by $1.14 to $48.86/bbl; again one of the factors was the weekly inventory number from the Energy Information Administration which showed inventories down by a fraction of a percentage point for the week. The market seems to react spontaneously to changes in that crude-stocks statistic. Up is bearish, down is bullish. These days even a very modest decline in inventories is bullish. But serious analysis requires a more detailed, more nuanced understanding of why crude oil inventories behave as they do. Were inventories driven up by higher production or lower refinery runs? By higher imports? By lower exports? The reasons behind the inventory change are more important than the change itself. Today we continue our series on the modeling of U.S. crude oil supply and demand, and the sourcing of input data used in those calculations.


- Blog
One Piece at a Time - The Numbers Behind U.S. Crude Oil Balances and Inventories
Crude oil prices are up more than $5/bbl over the past couple of weeks, mostly due to Middle East tensions and the latest readings of OPEC tea leaves. U.S. markets have contributed little to the bullish trend, with crude oil inventories hanging in there at 533.4 million barrels, just under the all-time record hit last week. U.S. production is up almost 800 Mb/d since the low last summer and a whopping 550 Mb/d since the OPEC/NOPEC deal. That’s some decidedly bearish statistics. If these trends hold, the U.S. could completely offset the 1.2 MMb/d in OPEC production cuts in another six months. But that begs the questions, where exactly do these statistics come from, and how should they be interpreted? The first answer is simple: it is the U.S. Energy Information Administration. But where do they get the numbers? And what can we learn about the crude oil market through a better understanding of the sources and assumptions behind these numbers? That is our topic in today’s blog.