After wallowing in contango for the past two months, the front months of WTI are shifting into backwardation which is generally a bullish signal for crude prices. In contango, the prices for future contracts are higher than prices today, with backwardation the opposite – future prices lower than today.
You might think contango is bullish because prices further out on the curve are increasing. But instead, what it really means is there is not enough demand today to soak up all of the available supply in the market, so prompt, near term prices are under pressure and trade below prices expected in the future. The converse is equally true. When prices today are above prices in the future, it means prompt demand exceeds supply, which is bullish for spot prices. That is the situation that it looks like WTI is moving into.
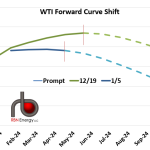
As shown in the graph below, on December 19, the first six months of the WTI curve were in relatively steep contango (solid green line), showing a $1.25/bbl difference between the prompt January contract and the June contract – the last month before the forward curve shifted into backwardation (dashed green line). But by Friday of last week (January 5, solid blue line), the difference between the now prompt February contract and the April contract (now the last month before backwardation, dashed blue line) had shrunk to a meager $0.06/bbl.
The WTI forward curve is definitely signaling that the short-term crude oil oversupply that has plagued the market since October has been worked off. We will know that for sure if the curve shifts into true backwardation this week.