On September 19, 2014, the operating margin for a representative Gulf Coast steam cracker running ethane hit a record high – an astonishing 70.4 cents per pound. Steam cracker margins depend not only on the spread between feedstock costs and the market price of ethylene but also on the varying amounts of propylene, butadiene and other byproducts that result from using different feedstocks. Understanding steam cracker profitability in the context of recent market developments is critically important, and it is the subject of RBN’s latest Drill-Down Report. In today’s blog we provide highlights of the report, which examines what is behind the ongoing shift from heavier to lighter NGL feedstocks, unveils RBN’s downloadable Steam Cracker Feedstock Selection Model, and discusses how new U.S. cracker capacity, NGL exports and other factors will impact these markets.
It’s hard not to be amazed at how much the world of NGLs and U.S. petrochemical production has changed—and the changes keep coming. Just a few years ago, the margins for heavier feedstocks such as naphtha and natural gasoline were higher than margins for lighter feedstocks like ethane and propane. As a result, steam crackers (a.k.a. petrochemical crackers or ethylene crackers) tended to maximize runs of those heavier feedstocks. Then came the Shale Revolution and lower natural gas prices, which in turn encouraged production of “wet” high-BTU natural gas that ultimately resulted in surpluses of lighter NGLs and low ethane, propane and butane prices. All that has caused a major shift at the 36 steam crackers operating in the U.S., which collectively produce about 60 billion pounds of ethylene per year. Currently, the feedstock slate of U.S. crackers is about 65% ethane, 20% propane, 7% butane, and 8% a combination of natural gasoline, naphtha and gas oil. As recently as 2008, naphtha and gas oil made up 30% of the steam cracker slate. As new ethane crackers come online in the next few years, the shift toward lighter feedstocks will only increase. At least that is the expectation.
The relative value of different feedstock margins is the most important factor that influences which feedstocks steam crackers choose to run. On Friday when the margin for ethane as a Gulf Coast steam cracker feedstock hit a record 70.4 cents per pound, ethane prices were very low, (24 cnts/gal) and ethylene prices were very high (76.5 cnts/lb). On the same day, the margin for a steam cracker running natural gasoline, a heavier NGL, was only 47.3 cnts/lb--an attractive margin for sure, but only two-thirds of the margin for ethane.
Figure #1 below shows long term feedstock margin trends in the left hand graphic and feedstock margin trends during 2014 in the right hand graphic. Note that margin trends have changed significantly over time, and are quite volatile on a day-to-day basis. For example, the feedstock margin for propane dropped precipitously in early 2014 in response to higher propane prices resulting from heavy demand from crop drying and the polar vortex (see A Perfect Storm). Over the past few weeks, margins are being driven higher primarily by ethylene shortages resulting from a rash of steam cracker unit outages, including Williams Geismar, Chevron Phillips’ Port Arthur and Exxon Mobil Baytown.
Note that Backstage Pass subscribers have access to RBN’s daily SpotCheck graphs, two of which track feedstock margins for ethane, propane, normal butane and natural gasoline. Spotcheck feedstock yields have been updated to match the yields in RBN’s Steam Cracker Feedstock Selection Model, included with today’s Drill-Down report.
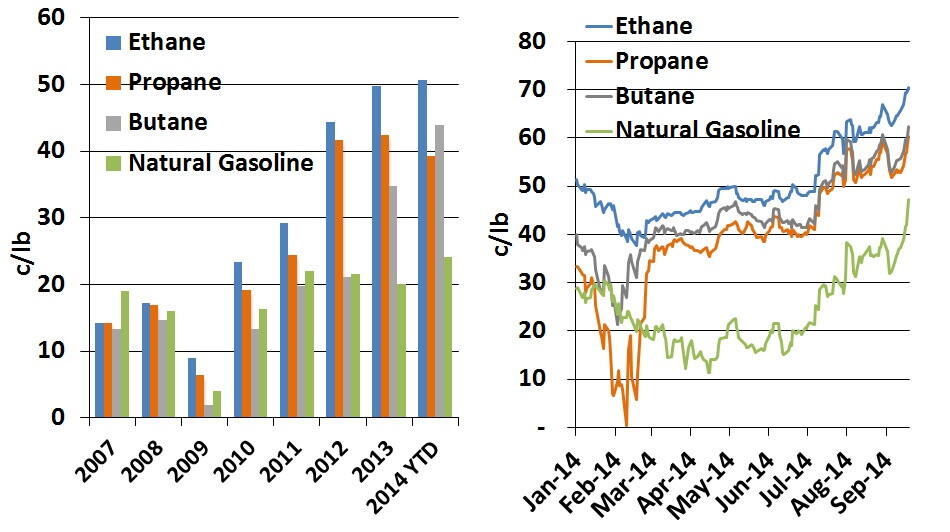
Figure #1 Steam Cracker Margins
Source: OPIS, Petrochemical Wire, CME/NYMEX (Click to Enlarge)
As a general rule, steam crackers make their feedstock selection decisions based on the most profitable slate of hydrocarbon liquids they can run, consistent with the physical and contractual constraints of their units. Stated simply, they run the feedstocks that will make them the most money. But there is much more to the margin calculation than the difference between the feedstock cost and the price of ethylene. Most of the “much more” has to do with byproducts. When a steam cracker produces ethylene, it also produces a range of byproducts like propylene, butadiene and benzene that have their own distinct market values. Each feedstock has a different yield of ethylene and byproducts, so the product yield and the prices of the byproducts are important variables in the margin calculation.
Much as the Shale Revolution caused major changes in steam cracker feedstock selection, the energy and petrochemical industries’ response to the new abundance of ethane and other lighter NGLs is leading to still more adjustments. For example, infrastructure is being built to export excess ethane supplies and billions of dollars in new U.S. steam cracker capacity (all of it likely to use ethane as its primary—or even sole--feedstock) is being planned and built, with start-up dates mostly in the 2017-20 timeframe (see Too Much of a Good Thing). That will certainly tighten the ethane market. Similarly, propane prices have increased over the past year in response to growing U.S. export volumes. As new LPG dock capacity is completed, exports of both propane and butane will increase further, putting still more upward pressure on prices. What will these developments mean for steam cracker margins? What are the relationships between petrochemical prices, feedstock prices and margins? Exactly how are steam cracker margins calculated?
Sure it’s all complicated, but so is football. And as every good fan knows, the more you “get” what’s happening on the gridiron—the audibles called at the line, the blocking and tackling, the special teams, the specific talents of individual players--the more fun it is to watch and follow. That’s the thinking behind RBN’s Drill-Down Report series, including the one being issued today covering petrochemical feedstock selection and NGL prices. The “What’s Crackin’” report begins with a backgrounder on the petrochemical industry’s significance to NGL producers. About half of US NGL production is used as feedstock for steam crackers, including virtually all of produced ethane (that is, the ethane not rejected into natural gas), as well as about 25% of total propane supply (from gas processing plants and refineries), 15% of normal butane and 10% of natural gasoline. Next, the report discusses how—despite increasing amounts of ethane rejection—US production of NGLs will grow to at least 3.3 MMb/d in 2015, compared with just over 2 MMb/d in 2010. It also provides the ins and outs on recent pricing trends for each NGL (and for naphtha and gas oil), and then gets into the meat of the matter: steam cracker margins and feedstock selection decisions.
Understanding all this requires at least a basic grasp of the steam cracking process, but as we’ve done in previous Drill-Downs, we’ve presented things in as non-geeky a way as possible. As in football, with its “bump-and-run” and “encroachment” and “Hail Mary,” the steam cracking business includes some terms like “residence time” and “quenching” that a newby will need to learn, but believe us, no chemical engineering degree is required.