U.S. crude oil production is back above where it was this time last year—at 9.1 MMb/d, 700 Mb/d over the low point last summer. Nearly 400 Mb/d of that surge has been since end-November when the OPEC deal was announced. So, in less than four months, U.S. producers have already taken one-third of the 1.2 MMb/d market share OPEC gave up. No doubt about it: The U.S. E&P sector is back. But not because prices are above $60 or $70/bbl. Instead, this recovery is being driven by rising productivity in the oil patch. And that makes it a whole different kind of animal than we’ve seen before, with implications for upstream, midstream, downstream and just about anything that touches energy markets. That’s the theme for our upcoming School of Energy—Spring 2017—“Back in the Saddle Again—Market Implications of the 2017 U.S. Oil and Gas Recovery” that we summarize in today’s blog.
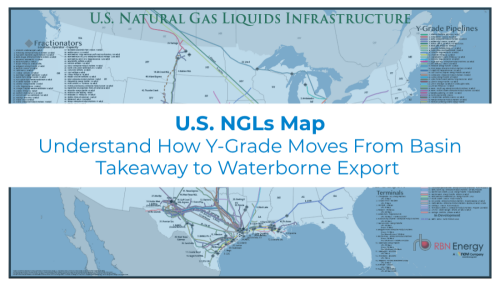
Visualize the infrastructure behind U.S. NGL movement.
The U.S. NGLs Map provides a comprehensive view of the transport, processing, and export networks moving NGLs across the U.S.
If you have spent much time with us in the RBN blogosphere, you know how we like to understand the supply/demand balance in the context of price trends, and vice versa. So we’ll start there by examining both recent history and the forward curve for U.S. domestic crude oil—West Texas Intermediate (WTI) at Cushing, OK. In the left graph in Figure 1 we have the trend line—or lack thereof—for WTI since January 2015. On average, the price for WTI has been $47/bbl (orange line); at one point “zooming” up to $60/bbl and last year at this time dropping briefly below $30/bbl (blue line). But for the most part, WTI has been hanging in a range pretty close to $50/bbl. And then on the Figure 1 right graph there is the forward curve—or, again, lack thereof. Same story. Fifty bucks in 2017, all the way out to 2021 and beyond. For a long time after crude prices crashed, the forward curve was in “contango” —futures prices rising steadily over time. And that was the case whether the spot price was $50/bbl or $30/bbl. But no longer. You can sell or buy $50/bbl U.S. crude oil for five years out, and even further into the future if you wish. And it is not just crude oil. The closing price on Friday for Henry Hub natural gas for June 2027 (that would be more than 10 years from now!) closed at $2.964/MMbtu, 11 cents below the closing price for April 2017. Now that’s a sobering statistic.
About the song
Back in the Saddle Again is the title of two very different songs. The first was written and recorded by singing cowboy Gene Autry in 1939. It became his signature song for the next 60 years and included the memorable line, “Out where a friend is a friend”. And then there is the other Back in the Saddle Again––the one by Aerosmith, written by Steven Tyler and Joe Perry, from the Rocks album. The song was released in 1977 and peaked at #38 on the Billboard Hot 100. And the most memorable line from that tune? “No tongue's drier than mine.”