Ever wonder why it seems like there are more NGL infrastructure projects being announced than for crude and natural gas? There is a good reason. Over the past ten years, NGL production has grown considerably more than both crude and gas, and it’s not slowing down.
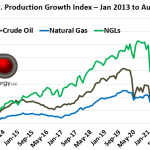
The graph below shows U.S. production for the three commodity groups with volumes indexed to production as of January 2013. That provides a broad, ten-year perspective on the growth trajectory of the three commodity groups. Crude oil (black line) is up to about 1.8X of January 2013. It has just now recovered to where it was prior to the COVID meltdown in 2020. Natural gas (blue line) did not dip as much as crude in 2020, nor has it grown as fast, coming in at 1.6X.
In the production growth derby, it is not even close. NGLs (green line) are now at a whopping 2.75X versus January 2013, as associated gas from crude plays – especially the Permian - have pushed NGL production higher, along with scores of new gas processing plants that extract as much NGLs from that gas as economically and mechanically possible. The winner is NGLs!