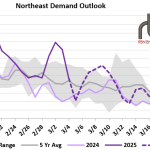
Demand for natural gas in the Northeastern U.S. averaged 27.5 Bcf/d for the week ended March 4, which was a decrease of 4.4 Bcf/d relative to the previous week. There was low demand last Wednesday and this Tuesday but higher demand over the weekend. Regional demand was up 6.4 Bcf/d from last year and 3.3 Bcf/d higher than the 5-year average. Res/Comm demand dropped by 3.4 Bcf/d week on week while Power demand fell by 1 Bcf/d and Industrial demand was up by 0.1 Bcf/d.
Featured Articles


- Blog
Sky's the Limit, Part 2 - How U.S. Demand is Factoring into the 2018 Gas Storage Injection Season
Lower 48 dry gas production has climbed 3 Bcf/d since April to nearly 82 Bcf/d this month to date, which is an average ~9 Bcf/d — or 12% — higher year-on-year. Despite that meteoric rise in supply, the U.S. gas storage inventory, which started the injection season well below year-ago and five-year average levels, continues to carry a substantial deficit. That’s because record demand volumes thus far have managed to keep storage injections in check. Today, we provide an update of the demand factors affecting the 2018 gas injection season.


- Blog
Summertime Blues - Potential Natural Gas Storage Scenarios for the Balance of Injection Season
Hurricane Harvey has dissipated, but the affected areas, including energy infrastructure and operations, are still in recovery mode and will be for some time to come. In the natural gas market, production fell as low as 71.3 Bcf/d this past week, and has now rebounded to pre-storm levels near 72 Bcf/d. But exports to Mexico, which were averaging near 4.4 Bcf/d in the 30 days prior to Harvey, were at 3.6 Bcf/d last Friday, still lagging 0.8 Bcf/d (18%) behind their pre-storm level, after dropping to as low as 2.85 Bcf/d last week. Deliveries for LNG export are also down nearly 1.0 Bcf/d (47%) from the 30-day average to just under 1.0 Bcf/d last Friday and dropped to about 475 MMcf/d over the weekend. Meanwhile, U.S. consumption — in the power, industrial and residential and commercial sectors — this past week averaged 62.8 Bcf/d, down 6.0 Bcf/d (9%) versus last year and also 1.6 Bcf/d (3%) lower than the five-year average for this time. In another important market development, Energy Transfer Partners’ new Rover Pipeline began partial service on Friday and deliveries rose to more than 500 MMcf/d over the weekend. What will these shifts mean for the gas market balance and storage inventory? Today, we continue our analysis of the gas market balance, this time with a forward look at potential storage scenarios for the balance of injection season.


- Blog
What's Going On? - Supply/Demand Factors Driving Natural Gas Price Volatility
<p>June was somewhat of a game-changer for the 2016 U.S. natural gas market. Summer weather finally arrived and U.S. consumption, particularly from power burn, was at record highs, as were exports to Mexico.</p>