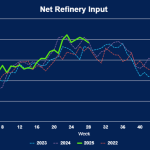
According to the EIA’s most recent Weekly Petroleum Status Report, total U.S. refinery net crude input declined by 157 Mb/d last week to 16.85 MMb/d — the lowest level since May, as shown at the far right of the green line in the chart below. Nationwide refinery utilization fell to 93.9%.
Featured Articles
- Blog
Achy Breaky Refineries? – Record Pace of Crude Refining Leads to Higher Fall Maintenance
During the first 7 months of 2015 the U.S. experienced record setting refinery crude processing and utilization rates. By the end of July crude inputs topped 17 MMb/d for the first time and nationwide refineries ran at over 96% of operable capacity - reaping the rewards of robust margins. But the party has been marred by a number of unexpected outages – the latest of which brought down a 250 Mb/d unit at BP’s Whiting, IN refinery last weekend – causing a spike in Chicago gasoline prices. Today we ponder why outages may be occurring and the upcoming impact of overdue fall maintenance.


- Blog
Slow Down - Combination of Factors Pull U.S. Crude Oil Exports Back From Record Highs
The U.S. has become an oil-exporting powerhouse in recent years, propelled by booming shale production, notably from the Permian Basin. U.S. crude oil now flows more freely than ever to help meet global demand, including to Europe, which increasingly turned to the U.S. following Russia’s invasion of Ukraine two-plus years ago, but exports have slowed recently. In today’s RBN blog, we examine a half-dozen reasons why the export surge has tapered off and why it may not change much in the weeks ahead.


- Blog
Comin' to America, Part 2 - Shale, Oil-Sands Production Gains Impacting U.S. Refineries' Crude Slates
Ten years ago, East Coast refineries imported virtually all of the crude oil they needed — 60% from OPEC, 21% from Canada, and 19% from other non-OPEC countries. Only five years later, in 2015, the tables had turned. PADD 1 refinery demand for crude remained unchanged at 1.1 MMb/d, but only 14% of the oil refined there came from OPEC, 23% from Canada, and 21% from other non-OPEC countries — the other 42% was either railed in from the Bakken or shipped in from the Eagle Ford and Permian. But the changes didn’t end there. Imports rebounded sharply in 2016 and 2017, when new pipelines were built out of those basins that pulled barrels away from PADD 1 and into more competitive refining markets. In the fall of 2020, imports are falling back again but for a different reason — with COVID-19 demand destruction and other woes, East Coast refinery demand for oil is down by almost half, with more cuts on the way. Today, we continue a series on U.S. oil imports with a look at the East Coast.