The June natural gas futures contract continued its upward swing today, as the front month passed the $2.30/MMbtu mark for the first time since January. The June contract has made gains in five of the last six trading days, and today’s upward swing was impacted by the EIA storage announcement. The EIA report showed a net injection of 79 Bcf in the U.S. Lower 48 for the week ended May 3. This was lower than all but one of the 13 estimates submitted to the Bloomberg survey, so the injection was more bullish than market expectations and contributed to today’s increase.
Featured Articles


- Blog
What's Going On? - Bullish EIA Storage Report Signals a Big Shift in the U.S. Natural Gas Market
The U.S. Energy Information Administration (EIA) on Thursday (June 9) reported a surprisingly bullish 65-Bcf injection for the week ended June 3—that was 8.0 Bcf below our Natgas Billboard estimate and more than 10 Bcf below the Bloomberg industry average assessment. In response, the CME/NYMEX Henry Hub July natural gas contract screamed about 15 cents higher following the report to a settle of $2.617/MMBtu, the highest daily settle for the prompt month in nearly 9 months. Thursday’s gains extended a rally that began on May 31 (2016) just after the July contract rolled to the front of the futures curve. It’s likely the rally was initially spurred by market participants looking to cover their short positions. But in the past week, an increasingly bullish fundamental picture has emerged prompting us to raise our price outlook (in our June 10 NATGAS Billboard report). In today’s blog, we analyze the fundamentals behind rising natural gas prices.


- Blog
Oops, (Winter's) Out of Time - Natural Gas Buyers Party Like It's 1999
After holding above $2/MMBtu in the first half of January, the CME/NYMEX February natural gas futures contract caved in this week, closing Tuesday and Wednesday at $1.895/MMBtu and $1.905/MMBtu, respectively. The last time we saw prices this low was in March 2016. But to see such levels trading in January, typically one of the coldest and highest-demand months of the year, you’d have to go back more than two decades — to 1999. Today, we explain the fundamentals behind the price collapse earlier this week and its implications for the 2020 gas market.


- Blog
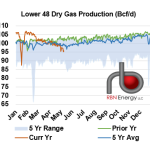
The Final Countdown - Bearish 2023 Gas Market Punctuates Last Throes of Shale Era Abundance
The Lower 48 natural gas market has had the most bearish start to a new year in a long time. Production has been at record highs, an exceptionally warm start to January suppressed demand, and LNG exports have been hobbled since last June when Freeport LNG went offline. The CME/NYMEX Henry Hub February gas futures contract slid to an 18-month low of $2.94/MMBtu last Thursday and expired Friday at $3.109/MMBtu, down 54% from where the prompt contract closed just two months earlier. The March contract extended the slide Monday to a 20-month low of $2.677/MMBtu. Freeport’s eventual return will restore existing export capacity, but there’s no new LNG export capacity due online this year — for the first time since 2016. After one of the tightest gas markets of the last decade in 2022, the stage is set for one of the most oversupplied markets we’ve seen in years. But the bulls out there can take solace: 2023 will also mark the final throes of the kind of oversupply conditions that defined the Shale Era as we know it. In today’s RBN blog, we discuss how we got here and RBN’s outlook for natural gas supply and demand.