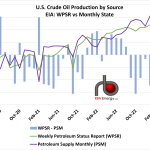
Total crude production has remained stymied near current levels of 12.2 – 12.3 MMb/d all year, per the EIA’s Weekly Petroleum Status Report (WPSR), however their Petroleum Supply Monthly (PSM) state production data disagrees. The PSM data, which is three-months in arrears and is widely accepted as being more accurate, shows U.S. production rose 175 Mb/d to 12.7 MMb/d in March, nearly 500 Mb/d over the WPSR reported volume. The current disparity between the two EIA figures is near the upper limit it has reached dating back to 2019. At least part of the disconnect is accounted for in the WPSR’s unaccounted for volume, which hit an unsettling 2 MMb/d last week.
Featured Articles


- Blog
One Piece at a Time - The Numbers Behind U.S. Crude Oil Balances and Inventories
Crude oil prices are up more than $5/bbl over the past couple of weeks, mostly due to Middle East tensions and the latest readings of OPEC tea leaves. U.S. markets have contributed little to the bullish trend, with crude oil inventories hanging in there at 533.4 million barrels, just under the all-time record hit last week. U.S. production is up almost 800 Mb/d since the low last summer and a whopping 550 Mb/d since the OPEC/NOPEC deal. That’s some decidedly bearish statistics. If these trends hold, the U.S. could completely offset the 1.2 MMb/d in OPEC production cuts in another six months. But that begs the questions, where exactly do these statistics come from, and how should they be interpreted? The first answer is simple: it is the U.S. Energy Information Administration. But where do they get the numbers? And what can we learn about the crude oil market through a better understanding of the sources and assumptions behind these numbers? That is our topic in today’s blog.


- Blog
What's Your Name - Explaining the EIA's Huge Unaccounted Crude Oil Imbalances
The numbers don’t add up. Literally. The most closely watched energy statistics in the world have a problem, and it’s been getting worse over the past two years. We’re talking about EIA’s U.S. crude oil supply, demand and inventory balances, which are published each week and then trued up about 60 days later in monthly data. The problem is that the balances don’t balance. EIA uses a plug number alternatively called “adjustment” or “unaccounted for” to force supply and demand to equate. That would not be an issue if the plug number was small and flipped frequently from positive to negative, likely due to timing inconsistencies with the input data. But that’s not the case. The number is mostly positive, meaning more demand than supply. And the difference can be mammoth: last week it was 2.3 MMb/d, or 18.4% of U.S. crude production. It seems like barrels are somehow materializing out of nowhere. But now we know where, because EIA just finished a 90-day study of the crude imbalance that reveals the sources of the problem and what it is going to take to fix it. In today’s RBN blog, we will delve into what has been causing the problem, what it means for interpreting EIA statistics, and what EIA is doing to address the issues.


- Blog
One Piece at a Time - U.S. Crude Oil Supply/Demand Balances, Inventories and Pricing
Last week, crude oil prices dropped below $50/bbl, in part due to continued increases in U.S. crude oil inventories, and fell further over the next few days. Then yesterday, prices perked up by $1.14 to $48.86/bbl; again one of the factors was the weekly inventory number from the Energy Information Administration which showed inventories down by a fraction of a percentage point for the week. The market seems to react spontaneously to changes in that crude-stocks statistic. Up is bearish, down is bullish. These days even a very modest decline in inventories is bullish. But serious analysis requires a more detailed, more nuanced understanding of why crude oil inventories behave as they do. Were inventories driven up by higher production or lower refinery runs? By higher imports? By lower exports? The reasons behind the inventory change are more important than the change itself. Today we continue our series on the modeling of U.S. crude oil supply and demand, and the sourcing of input data used in those calculations.