Last Thursday (March 28, 2013) the CME Henry Hub natural gas futures contract closed out the first quarter of 2013 at $4.024/MMBtu (prices slipped 0.9 cents to $4.015/MMBtu Monday). A year ago the futures price was $2.126/MMBtu – about half what it is today. During that same period, US dry gas production has risen by 0.5 Bcf/d to 64.1 Bcf/d and natural gas power burn has fallen by 2.2 Bcf/d (source: Bentek). With production still increasing and demand from power generation falling it seems unlikely that the market can sustain $4/MMBtu prices. Today we look at the supply demand picture at the end of the winter season.
The 25 percent run up in natural gas futures prices that we have seen during the first quarter of 2013 was caused primarily by colder weather increasing demand. The chart below shows US population weighted heating degree days (HDD - see Under the Weather – Cooling Degree Days for a description of how degree days are calculated). There were more HDDs during 2012-13 (red line) indicating that this winter was colder than the winter of 2011-12 (blue line) and you can see that since January temperatures this year have been quite a bit colder than last.
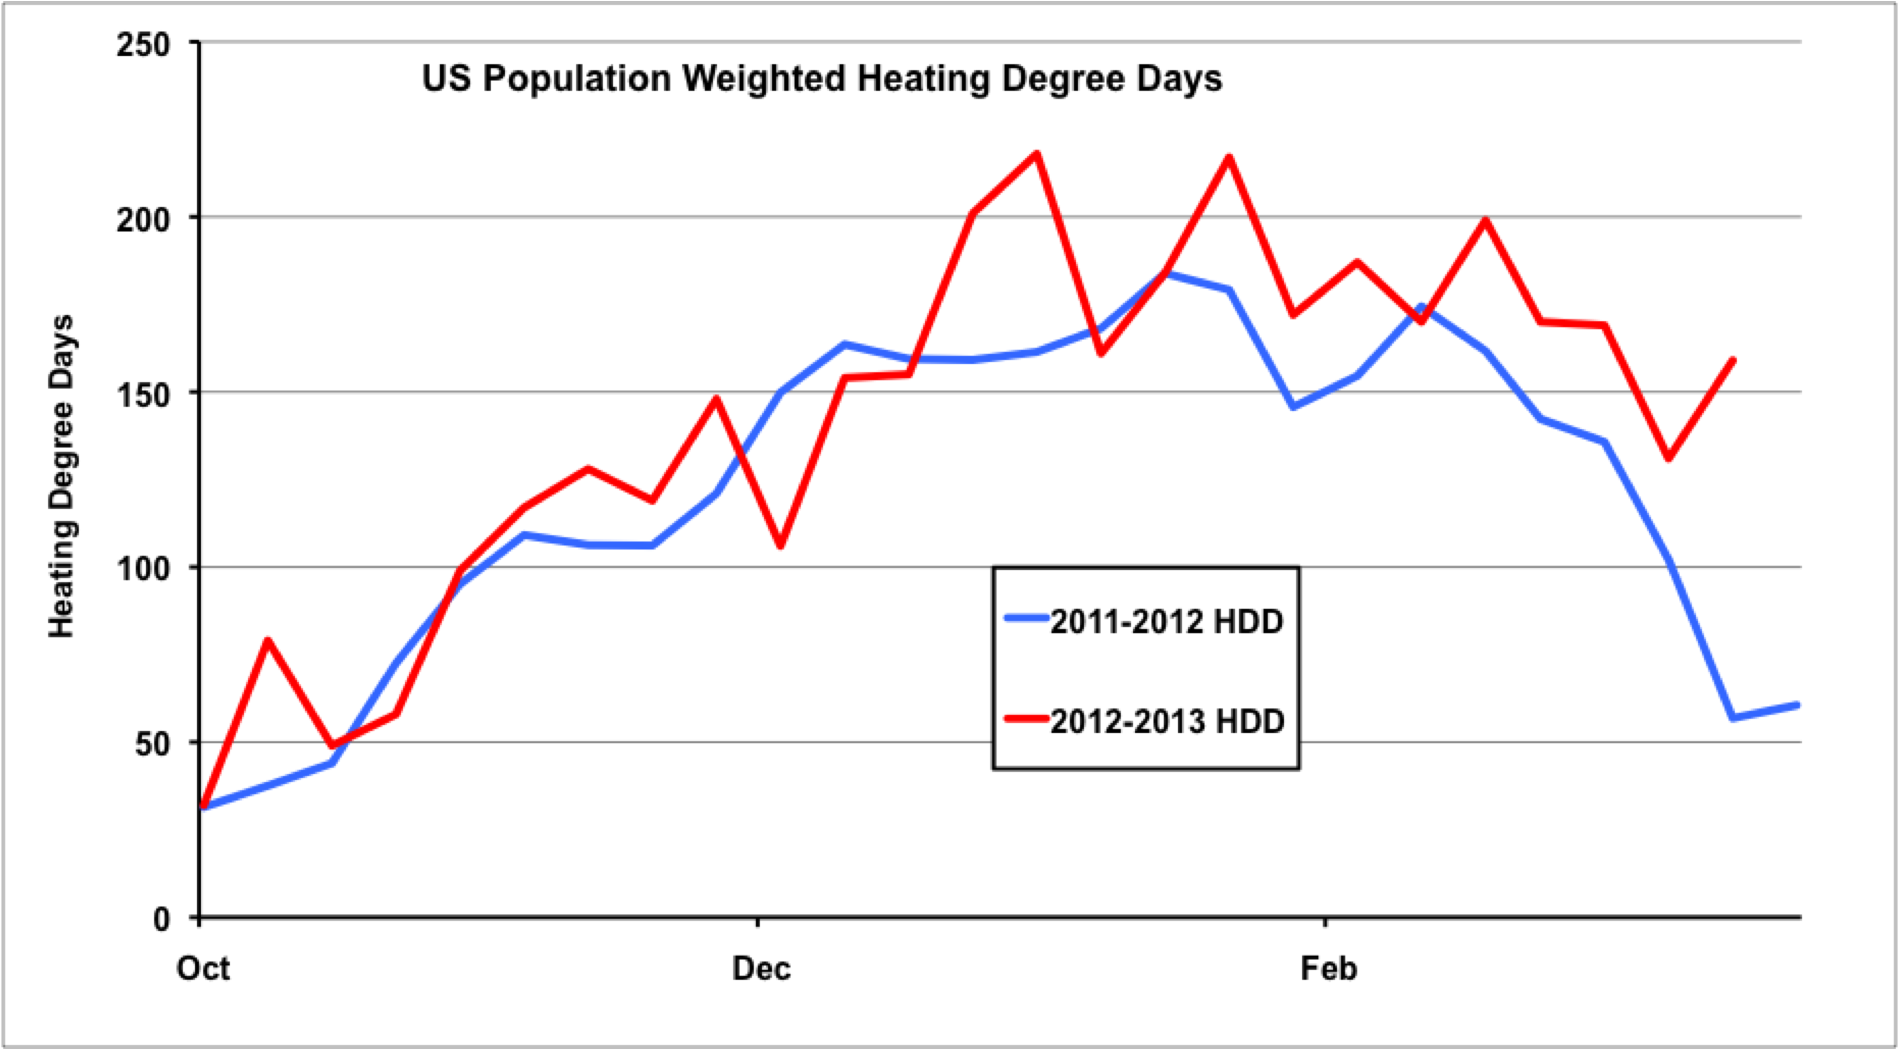
Source: National Oceanic Atmospheric Administration Data from Morningstar
Winter months generally see withdrawals of natural gas from storage as demand exceeds available pipeline supply from producing regions. Energy Administration Information (EIA) data shows that by the end of last winter (2011-12) natural gas storage had reached record levels for March – about a 40 percent surplus over the average of the previous 5 years. Colder weather this winter increased heating demand enough to whittle away nearly all that surplus over the 5 year average by the end of March. The chart below shows EIA natural gas estimated Lower 48 storage data for this winter (red line), last winter (blue line) and the 5 year average (green line). A larger than expected storage withdrawal last week (March 22, 2013) brought inventory down to within 60 Bcf of the 5 year average (black circle on the chart).

Source: EIA Data from Morningstar
To delve a little deeper into the factors that have impacted the gas market this winter and have a bearing on what we can expect this summer, we looked at the Bentek Cell Model daily natural gas supply demand balance for March 21, 2013. The table below shows the data with the supply position summarized in the top half and demand at the bottom. The left hand side of the table compares March 2013 against March 2012 and on the right are YTD comparisons. The supply data shows that natural gas dry production increased by 0.8 percent in 1Q 2013 to 64.1 Bcf/d versus the same period last year 63.6 Bcf/d (red circle) and by 1 percent this March versus last (blue circle). These increases in production come in spite of continued reduction in the Baker Hughes gas drilling rig count to a 14 year low (March 28, 2013). Improved drilling efficiency is part of the reason for this apparent contradiction but also new pipeline and processing plant infrastructure coming online is increasing the amount of gas that can be produced from a large inventory of incomplete wells.
About the song
The song “Spring” is on Leah West’s 2009 Beyond Words Album
Comments
It must be tough to generate good every day. Appetite for information fix is infinite. Here is why I think that answer is more complex this year. Basically I think the charts demand a pullback but fundamentals want the opposite.
Rapidly increasing production and combined with massive NG stocks have hidden numerous smaller bullish factors and structural changes that have been happening esp in the last 18months. In April and May we'll see what has changed in the baseline demand I'll guess It'll be higher by 3bcfd+ net over the 4 years before last.
1) between late 2011 and Apr 13 12+Gw of NG generating capacity came online while retiring 4-5 Gw coal. Most of the new NG capacity very thermally efficient 50%-58%. These plants can be baseload at higher NG prices. Were planned when NG prices were between $4-5. +2-3Bcf base (+5-6 summer)
2) Outages: Nuclear are well publicised, Coal is not. The coal vs NG consumption data for April and Nov points to significant coal plant outage in April and some in October. +3Bcf nuclear. Coal is not clear. But with outages switching to coal may not be an option in April. I believe we have seen evidence of that in the Bentek March weekly consumption data. That Powerburn was much higher in last report when NG prices were @$4 vs earlier in the month. at $3.50. We have become too familiar with switching now we are seeing sticking. Lets not forget that Coal to NG switching was happening even at $5 NG. Speaking of outages NG there are other coal costs that are amortized over the year- labor (healthcare) maintainance/outages. From a very fundamental view NG infrastructure is hyperreliable and cheap with no moving parts a closed system. Coal is full of trucks, trains, Pnumatic systems, ash management, conveyer belts lots of people, lots of breakdowns and lots of maintainence. Check out the CF statements of the IPPs.
3) Lower hydropower in California did not play a role 11-12 year. 10-11 before that it was a high year in hydro. 12-13 heavy rains (@190% norm) in Nov/Dec, CA NG demand was below norm. But with driest Jan +Feb on record. CA started see higher NG demand starting Jan 13. With Snowpack 52% of norm we'll see low hydro output. I think many have forgotten how much NG CA can consume in the summer. Well CA alone will bring on 2+Gw in April and June. CA does not switch to coal at any price and they are consuming more NG due to low hydro, San Onofre outage, more NG generation capacity due to Cap and Trade going into effect (more on this)
4) Industrial consumption is acclerating even with NG prices going up (causality?), with increased industrial activity close to 80% industrial utilization we are seeing the effect of structural input stock changes in energy intensive industries. Over the last two years refiners and manufacturers have changed processes to swithch from other fuels to NG. Mothballed petrochem facilities, aluminum smelters restarted diesel genrators retired. I'd estimate @1.5 - 2 Bcf of structural change in the last 18 months. Much more to come on this storyline over the years.
In conclusion structural shifts that were happening (because even $4 NG is very cheap) that were invisible last year are becoming visible now. There is 2+Bcfd higher consumption over production. This has been hidden by the enormous surplus. After this Thursday we'll have a 40Bcf deficit to the 5 year averages. Power industry's hold over the NG market will be gone. We'll start seeing worse build numbers YoY but the improvements over the 5 year averages will continue may even accelarate. improvements over the 5 year average are baked in for a while with high consumptio 2008 winter data falling off the 5 year avg.
Only thing that can change this picture is massive drilling quickly. But that will be kept in check by the massive gulf coast Propane and Ethane stocks. Petrochem mfg's will manage their use so that these stocks remain high for another year. Just like the power producers kept NG in check by using more coal in July, Aug and Nov 12.
California Cap and trade will have the most immediate impact on the power importers in CA. Once can already see the dractic reduction in coal mining in AZ, UT, CO and some in WY, MT even though they are the lowest cost coal (increased hydro in Dec also played a part). SCE LAPowerWater, reduce their coal powered imports. Feb 21 they had to report exactly which plant was the source of their power. CA cap and trade's impact will be huge as CA imports 25% of its power. This is ST and LT bullish for the cost producers in Canada (Horn River) and more demand for TX and Rockies gas. The YoY reduction in Coal prod. FERC bought these power importers another 18 months to make the switch by writing to CARB in September. But CARB will not back off. I have read the law and implementation strategy. They will make sure that coal is not used for their power. there may be some leakage but not much. So CA and surrounding state NG consumprion will continue to stay high with a wide spark spread.
This environment bodes well for western Canadian producers. I'm buying KWK best positioned for increase in production and revaluation of their Horn River (Marcellus of the west) If Kinder is able to convert the EP NG pipeline into Crude, Horn River gas will be hard to compete with. Liquids prices will however may be kept under pressure with increased propane production from the refiners and increased liquids production from Utica. None of the big Ethane projects come online before 2014.
The elimination of the NG excess and low NGL prices (still high stocks) puts changes the game. We cannot use the assumptions of the past 3 years anymore. The IPPs actually would like to see NG prices go up because their business models did rely on higher NG prices.
With Keystone Southern access, permian pipelines, Midwest refinery upgrades. and higher prices for inland crudes we'll see a Massive jump in production starting April (Bakken tundra will thaw soon, they drill but cannot complete) with a steeper jump in July. And the (speculative, but it aligns with their interest) chinese will try to do to the Crude market what was done to the NG market in the last few years. US+CA import (net) only 3.7 MMbl of Crude, I'll guess that will be less than 2 in 9 months. China would like to see that acclelarate as crude is a truer global commodity. The rug may pulled out from under the crude market for a while if Iran and Saudis (they will not cut anymore) make a play to keep their LT market share intact.
We are lot closer to $5.50 NG and significantly lower crude. All the incentives are in place. North American Crude producers are well hedged. I think Tom Ward will look like a genius for a second time in 5 years this Dec.
I'm Long KWK, SD, hoping for a WPRT bear raid before earnings.