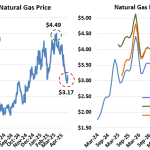
After hitting a two-year high on March 10 of $4.49/MMbtu, the Henry Hub front month futures price crashed, falling below $3/MMbtu on Friday, April 25. The weekly EIA storage report was blamed for the most recent decline, with working gas in storage coming in at 1,934 Bcf as of April 18. That was an 88 Bcf increase from the previous week, well above industry estimates. However, on Monday April 28 -the last day of trading for the April contract, the front month price popped back to $3.17/MMbtu, responding to oversold conditions in the futures market (left graph below).
Featured Articles


- Blog
What's Going On? - Bullish EIA Storage Report Signals a Big Shift in the U.S. Natural Gas Market
The U.S. Energy Information Administration (EIA) on Thursday (June 9) reported a surprisingly bullish 65-Bcf injection for the week ended June 3—that was 8.0 Bcf below our Natgas Billboard estimate and more than 10 Bcf below the Bloomberg industry average assessment. In response, the CME/NYMEX Henry Hub July natural gas contract screamed about 15 cents higher following the report to a settle of $2.617/MMBtu, the highest daily settle for the prompt month in nearly 9 months. Thursday’s gains extended a rally that began on May 31 (2016) just after the July contract rolled to the front of the futures curve. It’s likely the rally was initially spurred by market participants looking to cover their short positions. But in the past week, an increasingly bullish fundamental picture has emerged prompting us to raise our price outlook (in our June 10 NATGAS Billboard report). In today’s blog, we analyze the fundamentals behind rising natural gas prices.


- Blog
Oops, (Winter's) Out of Time - Natural Gas Buyers Party Like It's 1999
After holding above $2/MMBtu in the first half of January, the CME/NYMEX February natural gas futures contract caved in this week, closing Tuesday and Wednesday at $1.895/MMBtu and $1.905/MMBtu, respectively. The last time we saw prices this low was in March 2016. But to see such levels trading in January, typically one of the coldest and highest-demand months of the year, you’d have to go back more than two decades — to 1999. Today, we explain the fundamentals behind the price collapse earlier this week and its implications for the 2020 gas market.


- Blog
Hey Look Ma, I Made It - Permian Natural Gas Forward Curve Signals Better Days Ahead
The market’s spotlight in recent days has been on negative prices for both Permian crude oil and natural gas, but in the shadows a powerful rally has taken place in the forward market for Permian gas at the Waha hub. Much of this month’s price weakness for gas in West Texas has been driven by pipeline maintenance. But the Waha forward curve indicates market expectations for higher prices in May, and the possibility of a summer in which Permian gas prices could be some of the strongest on a consistent basis since negative pricing first appeared in the basin back in 2018. Today, we dive into the drivers behind the rise in forward Permian gas prices.