Stay current with key market indicators
Every day, we are bombarded with huge amounts of energy information. The key is knowing what is important and how to interpret it. In order to peer through all the noise and focus on the key facts and figures that encapsulate fundamental relationships, it helps to have a daily system. Chart Toppers is a tool for people who need to stay current with key market indicators and who value an analytic approach to tracking trends.
About the Models
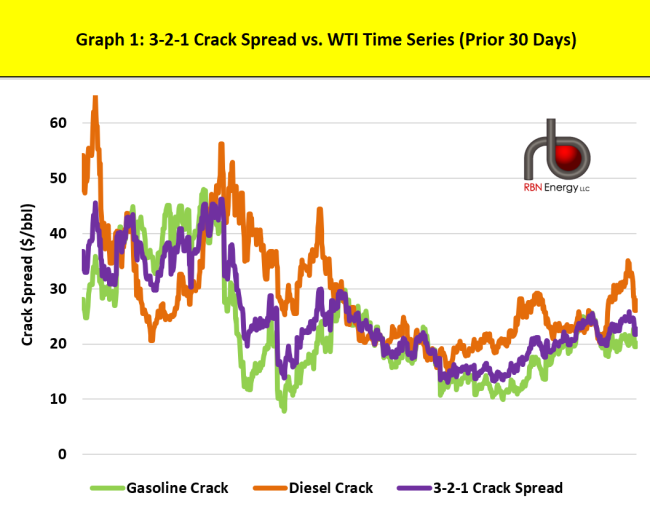
These models are yours. No secret formulas, no hidden data, no complicated links. Since you have the models, you can change the assumptions, manipulate the calculations, or use your own data. For example, if you want to look at a 2-1-1 crack spread instead of a 3-2-1, the model makes it easy to do. And we provide written instructions for how the model operates.
Additionally, we pull together key ratios so that you can know, at a glance, what has changed in the market. These ratios include Crude-to-Gas, Ethane-to-Gas, and NGL’s-to-Crude. Simple, current, and delivered to you every morning, it’s the perfect compliment to your morning RBN routine.
What You Get
Daily Excel File - Every weekday morning at 7 AM CT, RBN will email you a spreadsheet with the ratios and models as well as the supporting data to keep you informed of major market movements.
Chart Toppers Excel tabs include
Frac Spread
Petrochemical Feedstock Margins
Crack Spread
Prices
Ratios
Hydrogen Calculator